SLIDE 1
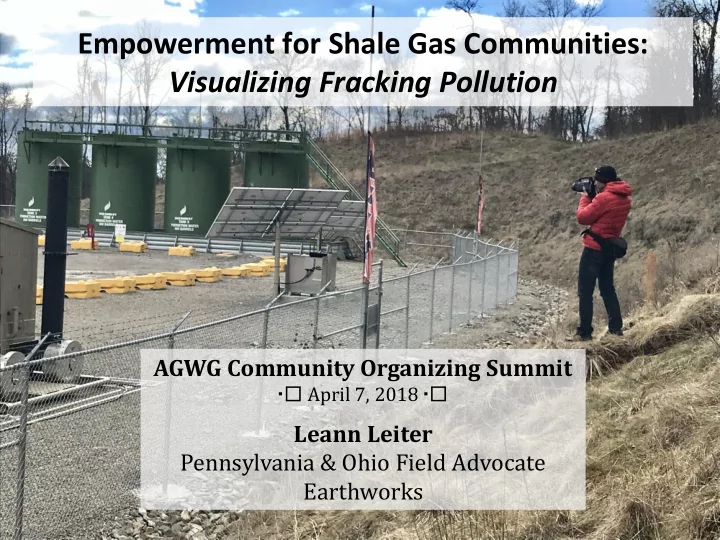
Empowerment for Shale Gas Communities: Visualizing Fracking Pollution
AGWG Community Organizing Summit
▪ April 7, 2018 ▪
Leann Leiter Pennsylvania & Ohio Field Advocate Earthworks
SLIDE 2
SLIDE 3
SLIDE 4
SLIDE 5
SLIDE 6
SLIDE 7
SLIDE 8
SLIDE 9
SLIDE 10
SLIDE 11
SLIDE 12
What’s happening where you live?
What are the main fracking-related fights happening where you live? What are some of the challenges?
SLIDE 13
https://youtu.be/3yVFGfr7vIc
SLIDE 14
https://youtu.be/K_6rIBJ-JSg
SLIDE 15 The problems with fracking
- Environmental impacts
- Habitat fragmentation
- Water contamination
- Contribution to climate change
- Infringement on human rights and civil rights
- Use of eminent domain
- Denial of access to information
- Health problems from exposures to:
- Contaminated water
- Noise and light pollution
- Stress
- Air pollution
SLIDE 16
Fracking impacts: A look at the literature
SLIDE 17 Fracking’s air pollution
Methane – A climate-disrupting VOC 86 times more powerful than CO2 Volatile Organic Compounds (VOCs) – Chemical gases which may have negative health effects Other air pollution concerns include:
- Carbon dioxide (CO2)
- Particulate matter
- Nitrogen oxide from diesel engine exhaust (NOx)
- Creation of ground-level ozone (from NOx and VOCs)
SLIDE 18 Air pollution pathways
Methane & VOCs emitted from:
- Oil & gas wells & equipment
- Pipelines & valves
- Compressor, pump, metering,
pigging stations: move & measure gas along pipelines
- Processing plants: separate &
create liquids (propane, butane, ethane)
- Engines and truck traffic
- Venting & flaring; pressure
releases (blowdowns)
SLIDE 19
The Oil & Gas Threat Map
SLIDE 20
West Virginia
SLIDE 21
Fracking near here?
SLIDE 22
Fracking near here?
SLIDE 23 The Community Empowerment Project
What is empowerment?
- "It’s a game-changer to expose this otherwise invisible air pollution and
allow communities, residents, and neighbors to see the pollution for the first time. Oftentimes people have smelled or suspected pollution for years, but never had the proof. Earthworks’ camera provides evidence, and… filing a complaint turns that evidence into real action that helps the whole community.”
- -Sharon Wilson, Earthworks’ Senior Organizer and certified thermographer
SLIDE 24
Recent investigations
Powhatan Point, Ohio – XTO Energy Well Pad explosion and 3-week “leak”
SLIDE 25
Recent investigations
Powhatan Point, Ohio – XTO Energy Well Pad explosion and 3-week “leak”
SLIDE 26
Recent investigations
Powhatan Point, Ohio – XTO Energy Well Pad explosion and 3-week “leak”
SLIDE 27
Recent investigations
Powhatan Point, Ohio – XTO Energy Well Pad explosion and 3-week “leak”
SLIDE 28 How it works: Some key terms
OGI = Optical Gas Imaging FLIR = Forward Looking InfraRed, a brand of OGI camera used by regulators and gas industry.
We use model GF320
VOCs = Volatile Organic Compounds: Climate disrupting or health-harming compounds
Camera detects 20 different VOCs associated with fracking, like methane, benzene and xylene
“Temp spot” = Indicator on FLIR camera screen that helps thermographers differentiate between heat and gases
SLIDE 29
https://youtu.be/wy3THzv1ISY
SLIDE 30 Visual evidence for empowerment
- Identify problems (odors, health symptoms) and
likely sources
- Partner with affected residents
- Visit sites, film emissions using Optical Gas
Imaging (OGI)
- File complaints based on experiences and
“hooks” in local, state, and federal rules (equipment, LDAR)
- Document and expose industry practices,
pollution, bad actors, repeat offenders
- Demand accountability
- Residents take evidence to local officials, media
- Regulators inspect, issue violations
- Operators required to change practices & permits
= pollution reductions
SLIDE 31 What we want to give you
FLIR footage
- bit.ly/CEP-WV
- bit.ly/CEP-OH
- youtube.com/user/earthworks
action/playlists Interview footage
And—we can provide video downloads so you can view without wifi!
SLIDE 32 Let’s gather up and brainstorm!
Helen Lockhart/Two Oceans Aquarium
SLIDE 33
Craft social media posts
Post to social media
SLIDE 34
Write an LTE
SLIDE 35
Show your elected officials
SLIDE 36
Show the world
What other ways or opportunities could you show the footage?
SLIDE 37 Engagement makes the difference
- OGI air monitoring = Provides evidence
- Press conferences & media = Demonstrates accountability (+shaming)
- Legislative visits = Reminder of constituent influence, sway votes
- Written comments = Builds a record, shows widespread support/opposition
- Municipal resolutions = Builds support, pushes states
- Protests = Builds solidarity, public pressure & power
- LTEs and Social media = Spreads the message quickly and easily
SLIDE 38
Thank you! Leann Leiter Ohio & PA Field Advocate
202-887-1872 x130 lleiter@earthworks.org @LeannLeiter
THANK YOU!