
SLIDE 1
23‐Mar‐15 1
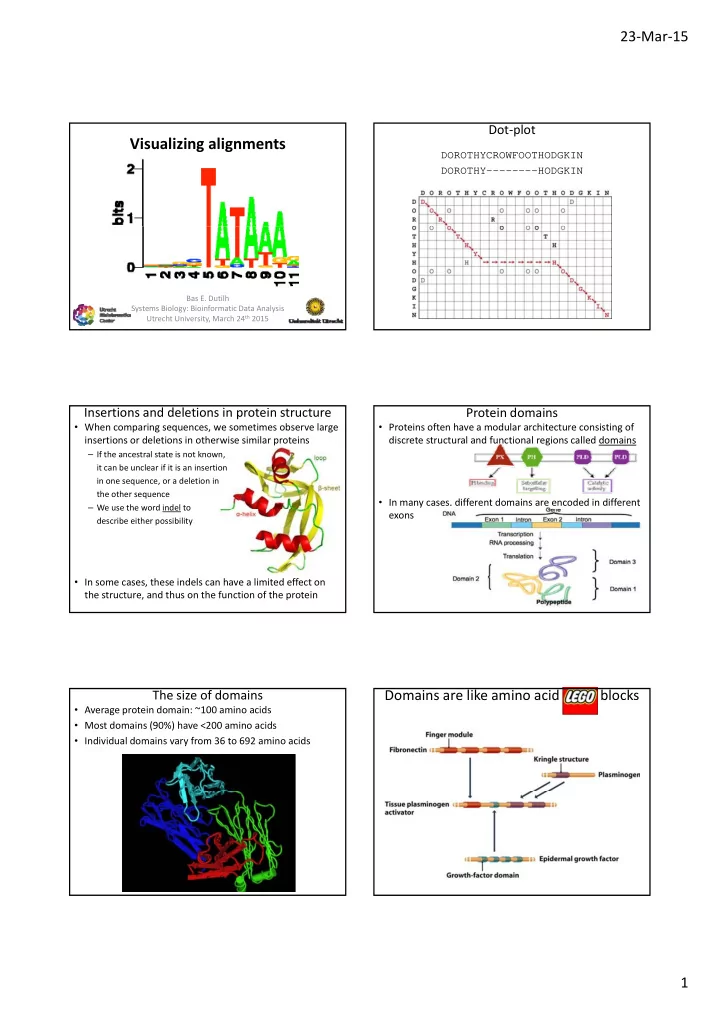
Visualizing alignments
Bas E. Dutilh Systems Biology: Bioinformatic Data Analysis Utrecht University, March 24th 2015
Dot‐plot
DOROTHYCROWFOOTHODGKIN DOROTHY--------HODGKIN
Insertions and deletions in protein structure
- When comparing sequences, we sometimes observe large
insertions or deletions in otherwise similar proteins
– If the ancestral state is not known, it can be unclear if it is an insertion in one sequence, or a deletion in the other sequence – We use the word indel to We use the word indel to describe either possibility
- In some cases, these indels can have a limited effect on
the structure, and thus on the function of the protein
Protein domains
- Proteins often have a modular architecture consisting of
discrete structural and functional regions called domains
- In many cases, different domains are encoded in different
exons
The size of domains
- Average protein domain: ~100 amino acids
- Most domains (90%) have <200 amino acids
- Individual domains vary from 36 to 692 amino acids