
SLIDE 1
1
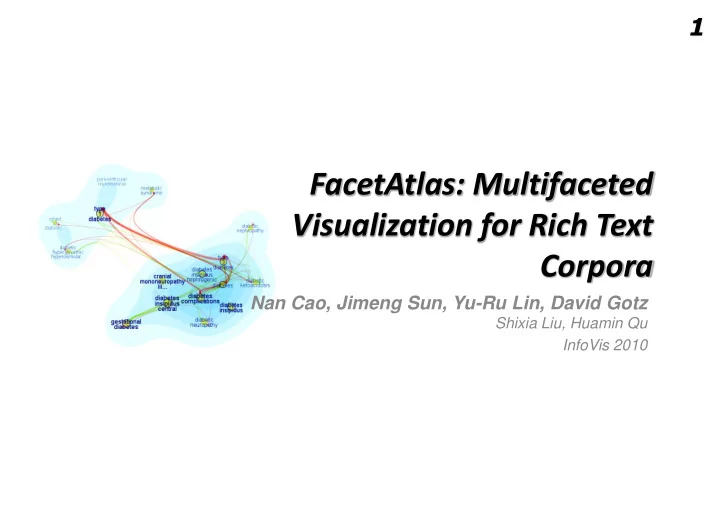
Nan Cao, Jimeng Sun, Yu-Ru Lin, David Gotz
Shixia Liu, Huamin Qu InfoVis 2010
Visualization for Rich Text Corpora Nan Cao, Jimeng Sun, Yu-Ru Lin, - - PowerPoint PPT Presentation
1 FacetAtlas: Multifaceted Visualization for Rich Text Corpora Nan Cao, Jimeng Sun, Yu-Ru Lin, David Gotz Shixia Liu, Huamin Qu InfoVis 2010 2 Introduction 3 multiple facets 4 Symptoms Treatments multiple facets Causes Tests &
Nan Cao, Jimeng Sun, Yu-Ru Lin, David Gotz
Shixia Liu, Huamin Qu InfoVis 2010
multiple facets
multiple facets
Metabolic Syndrome
Metabolic Syndrome
How to visualize the relations
Metabolic Syndrome
(Q1) How to model the document contents into multifaceted relation data? (Q2) How to intuitively visualize multifaceted document contents and their relations? (Q3) How to find the insight patterns visually driven by users’ interests?
– Visualize both the global (clusters) and local (relations) patterns in rich text corpora with multiple facets.
– Multifaceted entity-relational data model – Intuitive visual encoding and automatic layout – Users’ interests driven interaction for pattern detection
(Q2) How to intuitively visualize multifaceted document contents and their relations? (Q3) How to find the insight patterns visually driven by users’ interests?
document set entity set multifaceted entity relational data model facet segmentation symptom disease treatment entity extraction
type 1 diabetes type 2 diabetes take medications blood sugar control thirst blurred vision
Internal relations External relations
(Q1) How to model the document contents into multifaceted relation data?
(Q3) How to find the insight patterns visually driven by users’ interests?
1, 2 3, 4 3, 4 5, 6
<4, 2> <4, 3> <5, 3> <5, 1>
1, 2 2, 3 4
<1, 2> <1, 3>
encoding
layout data model
1, 2 3, 4 3, 4 5, 6
<4, 2> <4, 3> <5, 3> <5, 1>
1, 2 2, 3 4
<1, 2> <1, 3>
encoding
layout data model
16
Multifaceted Entity Relational Model
17
1 2 3 4 1 2 4 5 6 3
Type 2 Diabetes
disease
Type 1 Diabetes
Multifaceted Entity Relational Model
18
1 2 3 4 1 2 4 5 6 3
symptoms treatments
Type 2 Diabetes
disease
Type 1 Diabetes
Multifaceted entities External relations Internal relations
Multifaceted Entity Relational Model
19
1 2 3 4 1 2 4 5 6 3
symptoms treatments
disease
Type 2 Diabetes Type 1 Diabetes
Group entities by external relations Multifaceted entities External relations Internal relations
Multifaceted Entity Relational Model
Group internal relations
1 2 3 4
1, 2 3, 4 3, 4 5, 6 treatments
Type 2 Diabetes Type 1 Diabetes
relations by neighborhood
entities into multiple replicas
entities and their replicas in into the facet node
related internal linkages in the symptom facet
<1, 5> <2, 4> <3, 4> <3, 5>
Encoded external relation between disease facet and symptom facet Facet Node Grouped internal relation Overlapped entities has multiple replicas
1, 2 2, 3 4
1, 2 3, 4 3, 4 5, 6 Symptom facet node treatments
Type 2 Diabetes
disease
Type 1 Diabetes
the treatments entities into the treatment facet node
encoded the data model into visual form
<1, 5> <2, 4> <3, 4> <3, 5> <1, 2> <1, 3>
1, 2 3, 4 3, 4 5, 6
<4, 2> <4, 3> <5, 3> <5, 1>
1, 2 2, 3 4
<1, 2> <1, 3>
encoding
layout data model
23
24
density estimation entity layout sampling link layout
density estimation entity layout link layout sampling
build indices
query related samples
document set entity extraction facet segmentation symptom disease treatment
j i i i j i ij j i ij
X pre X d X X d
2 2 2
) ( 1 min
Cluster Together More smoothly
Based on the hidden internal relations of primary facet Keep users’ mental map while data changed
density estimation entity layout link layout sampling
RNN Cluster Layout density estimation entity layout link layout sampling
Layout external relations
swapping density estimation entity layout link layout sampling rotating
graph partition edge bundling density estimation entity layout link layout sampling
(Q1) How to model the document contents into multifaceted relation data? (Q2) How to visualize multifaceted information to reveal both global and local patterns?
Keyword Query Context Switch Filtering Highlighting
A set of interactions are designed to address users’ interests
context switch filtering Disease view Symptom view
– Co-occurrences pattern – Outlier pattern
Outlier Fever Headache Fatigue Shortness of Breath Co-occurrence Symptoms of HIV
usage and diagnosis decision support”
Nan Cao, Jimeng Sun, Yu-Ru Lin, David Gotz, Shixia Liu, Huamin Qu InfoVis 2010
Visualizing Local Relational Patterns Visualizing Global Content Patterns Search Interface
InfoVis 2000
InfoVis 09
Tag Cloud
InfoVis 2009
TVCG 2006
Grokker
Vast 2009
InfoVis 2009
InfoVis 2006
Visualizing Local Relational Patterns Visualizing Global Content Patterns Search Interface
InfoVis 2000
InfoVis 09
Tag Cloud
InfoVis 2009
TVCG 2006
Grokker
Vast 2009
InfoVis 2009
InfoVis 2006
42
43
– 3 domain experts (2 physicians with 30 years experience in the healthcare domain, and 1 young medical professional) – 20 common users without medical background (2 groups and 10 for each)
Health online documents
– T4 : identify the facet with the most cross-cluster connections. – T6 : identify the facet with the most
– Enhanced Traditional Graph Visualization – Based on the same framework with similarly interactions on the same dataset
surveys
Result (based on two tail t-test)
– Visualizing the clusters – Showing an overview of multiple connections across clusters – Representing the details of multifaceted connection between entities
– Finding the most connective facet within a cluster
Complete Time Task Success Rate
Keyword Query Context Switch Zooming Filtering Highlighting
Interaction interpretation Query Generator Result Processor
data indices
Interactive UI
query driven interaction mechanism
What data content need to be fetched? How to fetch? (sql, lucene query)
Fetch the data and convert the result into visual form A set of interactions are designed to address users’ interests
Interaction interpretation Query Generator Result Processor
data indices
query driven interaction mechanism
Fetch symptoms
SQL Select symptom from table where disease = “diabetes”
Covert the data into visual form
disease view
Increased thirst blur of vision
symptom view
show all symptoms related with diabetes
Context Switch
k i i k i k i k i k
Rotating step tunes node and linkage
tension based on a force model
density estimation entity layout link layout sampling
– Entities have strong connections over multiple entities – Semantic similarity metric defines what is “strong”
– Entities have “strong ” connections however “far away” from each other – Layout closeness defines what is “far away” – “strong ” and “far away”
– Automatic adjust the saturation of node
color by pattern metrics
M k k ij
j i sim sim
1
,
ij ij ij
sim d c
ij
d
the shortest path in the graph