
SLIDE 1
1
Text Visualization
Ma Maneesh Agrawala
CS 448B: Visualization Fall 2020
1
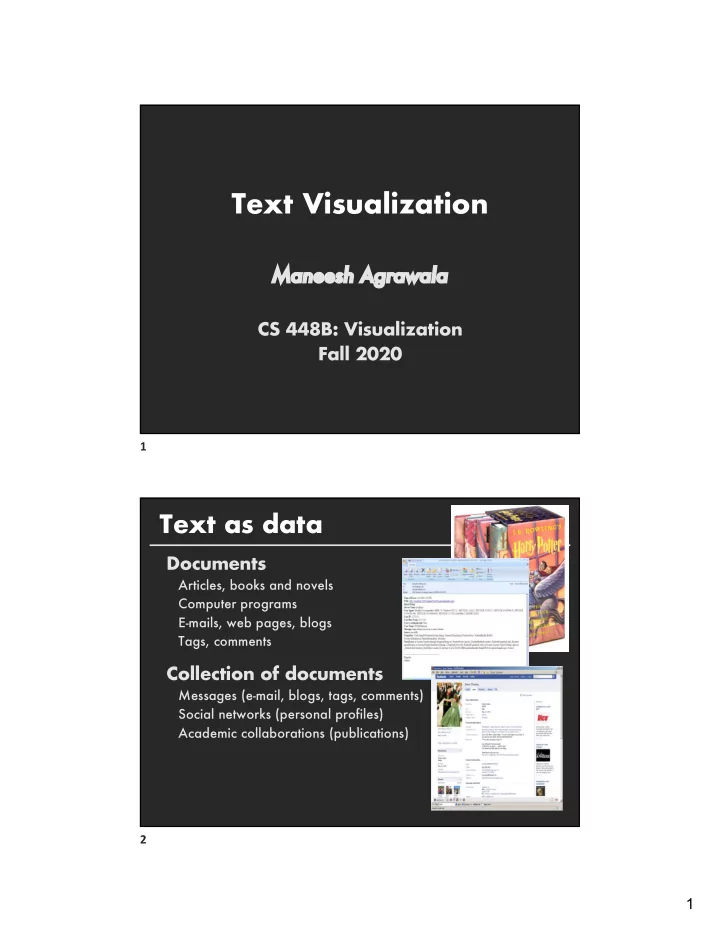
Text as data
Documents
Articles, books and novels Computer programs E-mails, web pages, blogs Tags, comments
Collection of documents
Messages (e-mail, blogs, tags, comments) Social networks (personal profiles) Academic collaborations (publications) 2