
SLIDE 1
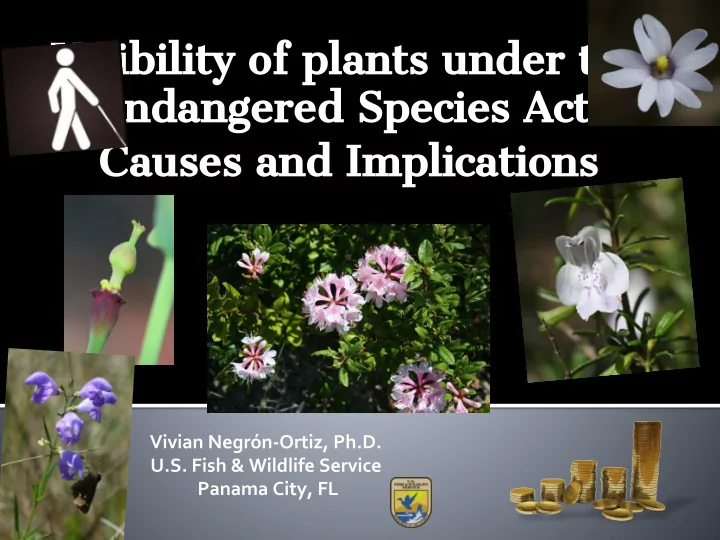
Visibility of plants under the Endangered Species Act: Causes and Implications
Vivian Negrón-Ortiz, Ph.D. U.S. Fish & Wildlife Service Panama City, FL
Visibility of plants under the Endangered Species Act: Causes and - - PowerPoint PPT Presentation
Visibility of plants under the Endangered Species Act: Causes and Implications Vivian Negrn-Ortiz, Ph.D. U.S. Fish & Wildlife Service Panama City, FL Are Plants inadequately protected under the ESA? Capacity Listing Recovery $$$
Vivian Negrón-Ortiz, Ph.D. U.S. Fish & Wildlife Service Panama City, FL
Listing Capacity $$$ spending Recovery
Pacific Southwest Great Lakes Big Rivers Southeast Northeast Mountain Prairie California & Nevada Alask a
4
Hawaii Puerto Rico & VI 9
9
Groups
R1 R2 R3 R4 R5 R6 R7 R8
Total
Amphibians 1 11 1 8 2 1 11 35 Arachnids 1 10 1 12 Birds 48 10 2 21 3 1 4 11 100 Clams 1 10 71 7 89 Crustaceans 2 5 1 6 5 8 27 Fishes 6 28 3 38 4 12 28 119
Plants
421 57 16 166 15 37 1 188
901
Insects 26 9 6 6 2 3 24 76 Lichens 2 2 Mammals 13 13 4 17 3 6 3 18 76 Reptiles 4 4 1 25 2 7 43 Snails 15 12 2 16 3 1 1 50
Total
537 160 46 377 45 61 8 296 1530
Astragalus humillinus
Prohibitions Animals Plants Endangered Plants Threatened
Import or export (into, out of, or through the U.S.) illegal illegal illegal Engage in interstate or foreign commerce illegal illegal illegal Remove and reduce to possession from Federal property illegal illegal illegal Maliciously damage or destroy on Federal property illegal illegal Remove, cut, dig up, damage, or destroy
law or regulation of any state including state criminal trespass law illegal illegal Remove, cut, dig up, damage, or destroy
illegal
Sensu: Kramer, A.T., B. Zorn-Arnold, and K. Havens. 2010. Assessing botanical capacity to address grand challenges in the United States.
Education and training
Monitoring & management
Research and application
(human,
physical, financial, and technological)
Management (leadership, networking and communication linkages)
Key components
◼ Conflict ◼ No-conflict
Number of species
Investment per species, per years 2008-2011 Number of listed species, 2011
Negron-Ortiz, V. 2014. Pattern of expenditures for plant conservation under the Endangered Species Act. Biological Conservation 171:36-43
◼ Investment
Investment per species, per years 2014-2015
Number of listed species, 2015
Endangered Threatened
Proporti
species
PLANTS: 59% VERTEBRATES: 24% INVERTEBRATES: 17%
Recovery Plan
Lack of financial support Private land: unequal protection Limited botany staffing
x x x Imperiled plants disappearing from public / private lands x x x Decision-makers not aware / informed about botanical issues x x Research, protection, & conservation: minimal x x Unequal implementation of species conservation protection x Low priority with agency managers
rare plant species within the Service.
implementation of the objectives and actions.
message within and outside the agency through directed outreach and communications.
An action Plan
Educate non-majors and the public to engage in lifelong appreciation of plants
Service and Conservation Specialists
Imperiled plants (>500 plants)
◼
coordinated by the Atlanta Botanical Garden’s Center for Southeastern Conservation
▪ and co-sponsored by the U.S. Fish
and Wildlife Service, U.S.D.A. Forest Service, National Wildlife Refuge Association, Georgia Department of Natural Resources, and the Georgia Plant Conservation Alliance.
◼
bring together government agencies, land managers, botanical gardens, university programs, and botanical experts
▪
Inform best practices and topics relevant to rare plant conservation
▪
Form a cohesive network of resources to support regional efforts for at-risk & listed plant species in the Southeastern U.S.
Listing Capacity $$$ spending Recovery
English Common Law Zoo-centric culture
The preceding presentation was delivered at the This and additional presentations available at http://nativeseed.info