
SLIDE 1
VENLO, 16 MAY 2017 DISCLAIMER. 2 THIS PRESENTATION AND ITS - - PowerPoint PPT Presentation
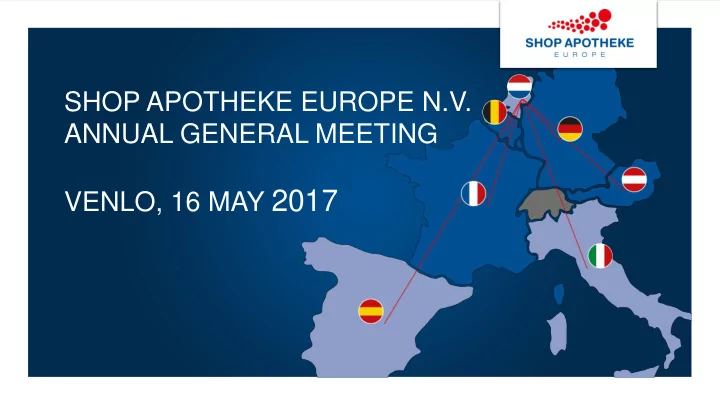
SHOP APOTHEKE EUROPE N.V. ANNUAL GENERAL MEETING VENLO, 16 MAY 2017 DISCLAIMER. 2 THIS PRESENTATION AND ITS CONTENTS ARE NOT FOR RELEASE, PUBLICATION OR DISTRIBUTION, IN WHOLE OR IN PART, DIRECTLY OR INDIRECTLY, IN THE UNITED STATES, AUSTRALIA,
THIS PRESENTATION AND ITS CONTENTS ARE NOT FOR RELEASE, PUBLICATION OR DISTRIBUTION, IN WHOLE OR IN PART, DIRECTLY OR INDIRECTLY, IN THE UNITED STATES, AUSTRALIA, CANADA OR JAPAN. IMPORTANT NOTICE The information contained in this Presentation has been provided by SHOP APOTHEKE EUROPE N.V. (the “Company” and, together with its shareholders, subsidiaries and associated companies, the “Group”) and has not been verified independently. Unless otherwise stated, the Company is the source of the information contained herein. For the purposes of this notice, the Presentation includes this document, its contents or any part of it and any related video or oral presentation, any question or answer session and any written or oral material discussed or distributed during the presentation meeting. Presentations are by their nature abbreviated information and cannot substitute for narrative information. In addition, the information herein is preliminary and is not comprehensive. Consistent with its purpose, this Presentation does not include all information that is material to evaluate the strengths and weaknesses as well as risks and opportunities of the Company. This Presentation does not constitute or form part of, and should not be construed as an offer or invitation or recommendation to, purchase or sell or subscribe for, or as any solicitation of any offer to purchase or subscribe for, any securities of the Company, in any
for or enter into any contract or make any other commitment whatsoever in relation to any such securities. No reliance may be placed for any purpose whatsoever on the information or opinions contained in the Presentation or on its completeness, accuracy or fairness. Neither the Company, the remainder of its Group nor its shareholders, any of their respective affiliates, directors, officers, employees, advisers or agents accepts any responsibility or liability whatsoever for or makes any representation or warranty, express or implied, as to the accuracy, completeness or fairness of the information or opinions in the Presentation (or whether any information has been omitted from the Presentation) or any other information relating to the Group, whether written, oral or in a visual or electronic form, and howsoever transmitted or made available or for any loss howsoever arising from any use of the Presentation
contained in this Presentation, and nothing in this Presentation is or should be relied on as a promise or representation as to the future. No statement in this Presentation is intended as a profit forecast or a profit estimate and no statement in this Presentation or any related materials should be interpreted to mean that earnings per share for the future or current financial periods would necessarily match or exceed historical published earning per share. This Presentation contains forward-looking statements based on the currently held beliefs and assumptions of the management of the Company, which are expressed in good faith and, in their opinion, are reasonable. Forward-looking statements involve known and unknown risks, uncertainties and other factors, which may cause the actual results, financial condition, performance, or achievements of the Company, or industry results, to differ materially from the results, financial condition, performance or achievements expressed or implied by such forward-looking statements. Many of these risks and uncertainties relate to factors that are beyond the Company’s ability to control or estimate precisely, such as future market conditions, currency fluctuations, the behavior of other market participants, the actions of regulators and other factors such as the Company’s ability to continue to obtain financing to meet its liquidity needs, changes in the political, social and regulatory framework in which the Group operates or in economic or technological trends or conditions. Given these risks, uncertainties and other factors, recipients of this document are cautioned not to place undue reliance on these forward-looking statements. It is up to the recipient of the Presentation to make its own assessment as to the validity of such forward-looking statements and assumptions. All information in this Presentation is current at the time of publication but may be subject to change in the future. The Company disclaims any obligation to update or revise any statements, in particular forward-looking statements, to reflect future events or developments. To the extent available, the industry and market data contained in the Presentation has come from official or third party sources. Third party industry publications, studies and surveys generally state that the data contained therein have been obtained from sources believed to be reliable, but that there is no guarantee of the accuracy or completeness of such data. While the Company reasonably believes that each of these publications, studies and surveys has been prepared by a reputable source, the data contained therein has not been independently verified by the Company or anyone else. In addition, certain of the industry and market data contained in the Presentation come from the Company’s own internal research and estimates based on the knowledge and experience of the Company’s management in the market in which the Company operates. While the Company believes that such research and estimates are reasonable and reliable, they, and their underlying methodology and assumptions, have not been verified by any independent source for accuracy or completeness and are subject to change. Accordingly, undue reliance should not be placed on any of the industry or market data contained in the Presentation. Statements contained in this Presentation regarding past events or performance should not be taken as a guarantee of future events or performance. Recipients of this Presentation should not treat the contents of this Presentation as advice relating to legal, taxation or investment matters, and must make their own assessments concerning such matters and other consequences of a potential investment in the Company and its securities, including the merits of investing and related risks. Any prospective purchaser of the Securities is recommended to seek its own independent financial advice. In receiving or otherwise accessing this Presentation, you will be deemed to have represented, agreed and undertaken (i) that you are permitted, in accordance with all applicable laws, to receive such information, (ii) that you are solely responsible for your own assessment of the business and financial position of the Company and that you will conduct your own analysis and be solely responsible for forming your own view of the potential future performance of the Company and (iii) that you have read and agree to comply with the contents of this notice. This Presentation has been presented to you solely for your information and must not be copied, reproduced, distributed or passed (in whole or in part) to any other person at any time. The distribution of the Presentation in certain jurisdictions may be restricted and accordingly it is the responsibility of any person into whose possession the Presentation falls to inform themselves about and observe any restrictions. The Presentation is only addressed to and directed at persons: (i) in member states of the European Economic Area (“EEA”) who are qualified investors within the meaning of Article 2(1)(e) of the Prospectus Directive (Directive 2003/71/EC and amendments thereto, including Directive 2010/73/EU, to the extent implemented in the relevant member state of the EEA) (“Qualified Investors”); (ii) in the United Kingdom, at Qualified Investors who are persons who have professional experience in matters relating to investments falling within Article 19(5) of the Financial Services and Markets Act 2000 (Financial Promotion) Order 2005, as amended (the “Order”) or who are high net worth companies, unincorporated associations and other bodies who fall within article 49(2)(a) to (d) of the Order; or (iii) persons to whom it may otherwise be lawful to communicate it to (all such persons together being referred to as “Relevant Persons”). The Presentation is directed only at Relevant Persons and must not be acted on or relied on by persons who are not Relevant Persons. Neither this Presentation nor any part or copy of it may be taken or transmitted into the United States of America (“United States”) or distributed, directly or indirectly, in the United States. The securities of the Company have not been and will not be registered under the United States Securities Act of 1933, as amended (the “Securities Act”) or the securities laws of any state in the United States and may not be offered or sold in the United States except in reliance on an applicable exemption from, or in a transaction not subject to, the registration requirements of the Securities Act. This Presentation and the information contained therein, is not directed to, or intended for viewing, release, distribution, publication or use by (directly or indirectly, in whole or in part), any person or entity that is a citizen of, or resident or located in, the United States, Australia, Canada or Japan or any jurisdiction where applicable laws prohibit its viewing, release, distribution, publication or use.
THIS PRESENTATION AND ITS CONTENTS ARE NOT FOR RELEASE, PUBLICATION OR DISTRIBUTION, IN WHOLE OR IN PART, DIRECTLY OR INDIRECTLY, IN THE UNITED STATES, AUSTRALIA, CANADA OR JAPAN.
1. Opening and report and presentation of the managing board 2. Annual for the financial years 2015 and 2016 3. Adoption of the Annual Accounts 2015 4. Adoption of the Annual Accounts 2016 5. Proposal to allocate the results of the financial years 2015 and 2016 6. Discharge from liability of the members of the managing board 7. Discharge from liability of the members of the supervisory board 8. Remuneration policy managing board and supervisory board 9. Appointment of BDO as external auditor for 2017 10. Designation of the managing board as the corporate body authorized to issue shares and restrict or exclude pre-emptive rights 11. Authorization of the managing board to acquire shares in the Company’s own share capital 12. Questions and any other business 13. Closing
THIS PRESENTATION AND ITS CONTENTS ARE NOT FOR RELEASE, PUBLICATION OR DISTRIBUTION, IN WHOLE OR IN PART, DIRECTLY OR INDIRECTLY, IN THE UNITED STATES, AUSTRALIA, CANADA OR JAPAN.
THIS PRESENTATION AND ITS CONTENTS ARE NOT FOR RELEASE, PUBLICATION OR DISTRIBUTION, IN WHOLE OR IN PART, DIRECTLY OR INDIRECTLY, IN THE UNITED STATES, AUSTRALIA, CANADA OR JAPAN.
THIS PRESENTATION AND ITS CONTENTS ARE NOT FOR RELEASE, PUBLICATION OR DISTRIBUTION, IN WHOLE OR IN PART, DIRECTLY OR INDIRECTLY, IN THE UNITED STATES, AUSTRALIA, CANADA OR JAPAN.
Source: SHOP APOTHEKE EUROPE.
MICHAEL KÖHLER
CEO & Major Shareholder Strategy, M&A, Purchasing, HR, Regulatory
the pharmaceutical industry (Hoechst, Aventis)
STEPHAN WEBER
CMO, Deputy CEO & Co-founder Business Development, Marketing & Sales
pharmaceutical & online experience
since 2001
CFO Finance
work experience (incl. Fresenius, Hoechst)
THERESA HOLLER
COO Chief Pharmacist, Operations & Customer Services
experience in leading mail-order pharmacies (incl. DocMorris)
MARC FISCHER
IT & Co-founder IT, Technology and Products
experience in IT (incl. Credit Suisse, Bechtle)
THIS PRESENTATION AND ITS CONTENTS ARE NOT FOR RELEASE, PUBLICATION OR DISTRIBUTION, IN WHOLE OR IN PART, DIRECTLY OR INDIRECTLY, IN THE UNITED STATES, AUSTRALIA, CANADA OR JAPAN.
2016 Revenue
2016 Cash & short-term securities
2016 Gross Profit 2015 Active customers
2015 Revenue 2015 Gross Profit 2015 Cash 2016 Active Customers
THIS PRESENTATION AND ITS CONTENTS ARE NOT FOR RELEASE, PUBLICATION OR DISTRIBUTION, IN WHOLE OR IN PART, DIRECTLY OR INDIRECTLY, IN THE UNITED STATES, AUSTRALIA, CANADA OR JAPAN.
First mover advantage in European expansion 7 countries served from our Venlo pharmacy.
“Already prepared to effectively meet tomorrow´s demand.”
Christian Brüggemann Director Operations SHOP APOTHEKE EUROPE
THIS PRESENTATION AND ITS CONTENTS ARE NOT FOR RELEASE, PUBLICATION OR DISTRIBUTION, IN WHOLE OR IN PART, DIRECTLY OR INDIRECTLY, IN THE UNITED STATES, AUSTRALIA, CANADA OR JAPAN.
Source: SHOP APOTHEKE EUROPE, Sempora Research, Cosmetics Europe Research. All market sizes exclude VAT. Note: OTC is defined as non-prescription medication. Continental Europe excludes the UK and certain small EU countries; countries included are: Germany, France, Italy, Spain, Poland, Romania, Netherlands, Belgium, Portugal, Czech Republic, Hungary, Sweden, Bulgaria, Denmark, Slovakia, Norway, Austria. 1) Based on Sempora estimates (2015) incl. VAT adjusted by Rx VAT rate (source: Statista). 2) Euromonitor International; online penetration calculated by dividing the internet retailing market size across Continental Europe by the total market size for each vertical.
Entire Pharma and BPC € 184bn
Huge Addressable Market – Continental Europe2) (2015, € bn)
RX = highly restrictive regulation € 120bn1) Non-Pharmacy Related BPC € 31bn Pharmacy Related BPC € 19bn OTC Medication € 14bn € 33 bn Current Focus Market
Highly Fragmented Market – No Upcoming Competitor From Consolidation Play
€ 33bn Continental Europe Pharmacy chains ~5 % Independent Pharmacies ~95 % Pharmacy chains not permitted in most countries ~70 %, therefore no economies
market
THIS PRESENTATION AND ITS CONTENTS ARE NOT FOR RELEASE, PUBLICATION OR DISTRIBUTION, IN WHOLE OR IN PART, DIRECTLY OR INDIRECTLY, IN THE UNITED STATES, AUSTRALIA, CANADA OR JAPAN.
Source: SHOP APOTHELE EUROPE.
CORE TARGET GROUP, WOMEN AGED 31 TO 59 AND FAMILIES.
GOLDEN AGERS, WOMEN & MEN, AGED 60 PLUS.
FUTURE CORE TARGET GROUP, WOMEN UNDER 30.
THIS PRESENTATION AND ITS CONTENTS ARE NOT FOR RELEASE, PUBLICATION OR DISTRIBUTION, IN WHOLE OR IN PART, DIRECTLY OR INDIRECTLY, IN THE UNITED STATES, AUSTRALIA, CANADA OR JAPAN.
Source: SHOP APOTHEKE EUROPE. Note: Continental Europe excludes the UK and certain small EU countries; countries included are: Germany, France, Italy, Spain, Poland, Romania, Netherlands, Belgium, Portugal, Czech Republic, Hungary, Sweden, Bulgaria, Denmark, Slovakia, Norway, Austria. #1 OTC position in terms of revenue .
First mover advantage in European expansion
Organic Footprint Footprint Expansion – FARMALINE
THIS PRESENTATION AND ITS CONTENTS ARE NOT FOR RELEASE, PUBLICATION OR DISTRIBUTION, IN WHOLE OR IN PART, DIRECTLY OR INDIRECTLY, IN THE UNITED STATES, AUSTRALIA, CANADA OR JAPAN.
THIS PRESENTATION AND ITS CONTENTS ARE NOT FOR RELEASE, PUBLICATION OR DISTRIBUTION, IN WHOLE OR IN PART, DIRECTLY OR INDIRECTLY, IN THE UNITED STATES, AUSTRALIA, CANADA OR JAPAN.
Source: SHOP APOTHEKE EUROPE. *We define active customers as unique customers who are active in 12 months preceeding a given period of time including the FARMALINE customer base in Q4.
growth.
Number of Active Customers (in m)
THIS PRESENTATION AND ITS CONTENTS ARE NOT FOR RELEASE, PUBLICATION OR DISTRIBUTION, IN WHOLE OR IN PART, DIRECTLY OR INDIRECTLY, IN THE UNITED STATES, AUSTRALIA, CANADA OR JAPAN.
its online pharmacy leadership
Web traffic (in m)
Share of mobile visits (%) Source: SHOP APOTHEKE EUROPE.
THIS PRESENTATION AND ITS CONTENTS ARE NOT FOR RELEASE, PUBLICATION OR DISTRIBUTION, IN WHOLE OR IN PART, DIRECTLY OR INDIRECTLY, IN THE UNITED STATES, AUSTRALIA, CANADA OR JAPAN.
with basket size > € 52 and return rates close to zero.
international expansion resulting in new customers.
Share of repeat orders (%) Average basket size (in €)
Number of Orders in '000
Source: SHOP APOTHEKE EUROPE.
THIS PRESENTATION AND ITS CONTENTS ARE NOT FOR RELEASE, PUBLICATION OR DISTRIBUTION, IN WHOLE OR IN PART, DIRECTLY OR INDIRECTLY, IN THE UNITED STATES, AUSTRALIA, CANADA OR JAPAN.
September 14 was done by year-end, i.e. much earlier than expected, saving integration costs in 2017.
to hold additional inventory needed for our international expansion.
support strong European sales growth in 2017.
to lower operations costs.
packing line was accomplished successfully.
THIS PRESENTATION AND ITS CONTENTS ARE NOT FOR RELEASE, PUBLICATION OR DISTRIBUTION, IN WHOLE OR IN PART, DIRECTLY OR INDIRECTLY, IN THE UNITED STATES, AUSTRALIA, CANADA OR JAPAN.
leading German business newspaper, conducted some 700,000 representative online interviews during the period from 1.2.2016 to 31.1.2017.
best value for money.
confirming that the German TV branding budget has been a valuable investment.
Source: Handelsblatt/YouGov.
THIS PRESENTATION AND ITS CONTENTS ARE NOT FOR RELEASE, PUBLICATION OR DISTRIBUTION, IN WHOLE OR IN PART, DIRECTLY OR INDIRECTLY, IN THE UNITED STATES, AUSTRALIA, CANADA OR JAPAN.
THIS PRESENTATION AND ITS CONTENTS ARE NOT FOR RELEASE, PUBLICATION OR DISTRIBUTION, IN WHOLE OR IN PART, DIRECTLY OR INDIRECTLY, IN THE UNITED STATES, AUSTRALIA, CANADA OR JAPAN.
Source: SHOP APOTHEKE EUROPE. Note:1) Medications shown are for indicative purposes only.
Increasing shopping cart by age Seasonal demand for OTC1) throughout the year
COLD, FLU VITAMINS SUN CREAM ALLERGIES 0 – 39 40 – 59 > 60
Family, Beauty Strengthen- ing, Beauty Chronic Diseases, Beauty
THIS PRESENTATION AND ITS CONTENTS ARE NOT FOR RELEASE, PUBLICATION OR DISTRIBUTION, IN WHOLE OR IN PART, DIRECTLY OR INDIRECTLY, IN THE UNITED STATES, AUSTRALIA, CANADA OR JAPAN.
Source: SHOP APOTHEKE EUROPE, Sempora Research, Euromonitor. Note: 1) Online penetration calculated by dividing the Internet retailing market size across Continental Europe by the total market size for each vertical. 2) Excludes Germany and the UK and certain small EU countries; countries included are: France, Italy, Spain, Poland, Romania, Netherlands, Belgium, Portugal, Czech Republic, Hungary, Sweden, Bulgaria, Denmark, Slovakia, Norway, Austria.
OTC & Pharmacy Related BPC 2015
Germany Continental Europe ex Germany2)
2 % 13.5 %
Levels already achieved in Germany driven by SAE Enormous upside potential
Expected OTC mailorder market growth 2020
(Source: Sempora market research 2017)
2015 2020 OTC online pharmacy market (in € m)
1.017 2.042
DE
101 % 97 430
FR
342 % 63 315
IT
397 % 83 271
ES
225 % 55 151
AT
174 % 29 81
BE
179 % 18 48
NL
167 %
THIS PRESENTATION AND ITS CONTENTS ARE NOT FOR RELEASE, PUBLICATION OR DISTRIBUTION, IN WHOLE OR IN PART, DIRECTLY OR INDIRECTLY, IN THE UNITED STATES, AUSTRALIA, CANADA OR JAPAN.
23.7 % 24.7 %
2015 estimates CAGR 2016-2018 2016 estimate CAGR 2016-2018
expect the online pharmacy market to grow by 24.7% annually until 2018.
even more important for SHOP APOTHEKE.
and to start automation already in the fourth quarter 2016 has been the right step to keep up with accelerated market growth also in 2017. The growth of the Online pharmacy market in Continental Europe is speeding up
Source: SEMPORA.
THIS PRESENTATION AND ITS CONTENTS ARE NOT FOR RELEASE, PUBLICATION OR DISTRIBUTION, IN WHOLE OR IN PART, DIRECTLY OR INDIRECTLY, IN THE UNITED STATES, AUSTRALIA, CANADA OR JAPAN.
the online OTC pharmacy market in Continental Europe grew by 17% in 2016 compared to 2015.
EUROPE has boosted its growth to 41%, growing more than twice fast as the market.
increase of SHOP APOTHEKE EUROPE’s market share is expected. SHOP APOTHEKE EUROPE INCREASES ITS MARKET SHARE IN CONTINENTAL EUROPE
Source: SEMPORA.
+17% +41%
Continental European Market SHOP APOTHEKE EUROPE
THIS PRESENTATION AND ITS CONTENTS ARE NOT FOR RELEASE, PUBLICATION OR DISTRIBUTION, IN WHOLE OR IN PART, DIRECTLY OR INDIRECTLY, IN THE UNITED STATES, AUSTRALIA, CANADA OR JAPAN.
compared to FY 2016.
expansion and automation planned at c. € 10m.
Medium-/long-term:
by further increase of repeat orders followed by continued new customer acquisition medium-term.
penetration in Austria, France, Belgium as well as new markets Italy and Spain.
THIS PRESENTATION AND ITS CONTENTS ARE NOT FOR RELEASE, PUBLICATION OR DISTRIBUTION, IN WHOLE OR IN PART, DIRECTLY OR INDIRECTLY, IN THE UNITED STATES, AUSTRALIA, CANADA OR JAPAN.
THIS PRESENTATION AND ITS CONTENTS ARE NOT FOR RELEASE, PUBLICATION OR DISTRIBUTION, IN WHOLE OR IN PART, DIRECTLY OR INDIRECTLY, IN THE UNITED STATES, AUSTRALIA, CANADA OR JAPAN.
THIS PRESENTATION AND ITS CONTENTS ARE NOT FOR RELEASE, PUBLICATION OR DISTRIBUTION, IN WHOLE OR IN PART, DIRECTLY OR INDIRECTLY, IN THE UNITED STATES, AUSTRALIA, CANADA OR JAPAN.
Continued strong growth in all key countries in Continental Europe.
Repeat orders
Available products
Attractive cart size
Average monthly visits
THIS PRESENTATION AND ITS CONTENTS ARE NOT FOR RELEASE, PUBLICATION OR DISTRIBUTION, IN WHOLE OR IN PART, DIRECTLY OR INDIRECTLY, IN THE UNITED STATES, AUSTRALIA, CANADA OR JAPAN.
2015 and exceeded the 2016 sales target.
accelerating group sales growth.
than tripled compared to 2015.
Group Sales Development (€ m) International Sales Development (€ m)
126 177
2015 2016
+ 41 %
8 30
2015 2016
+ 262 %
THIS PRESENTATION AND ITS CONTENTS ARE NOT FOR RELEASE, PUBLICATION OR DISTRIBUTION, IN WHOLE OR IN PART, DIRECTLY OR INDIRECTLY, IN THE UNITED STATES, AUSTRALIA, CANADA OR JAPAN.
2016 target growth rates were exceeded.
Revenue in € m
126 177
FY 2015 FY 2016
Gross Profit in € m
25.7 36.3
FY 2015 FY 2016
Source: SHOP APOTHEKE EUROPE.
+41 % + 41 %
THIS PRESENTATION AND ITS CONTENTS ARE NOT FOR RELEASE, PUBLICATION OR DISTRIBUTION, IN WHOLE OR IN PART, DIRECTLY OR INDIRECTLY, IN THE UNITED STATES, AUSTRALIA, CANADA OR JAPAN.
as of 30 September 2015 with effect from January 2015.
Source: SHOP APOTHEKE EUROPE.
THIS PRESENTATION AND ITS CONTENTS ARE NOT FOR RELEASE, PUBLICATION OR DISTRIBUTION, IN WHOLE OR IN PART, DIRECTLY OR INDIRECTLY, IN THE UNITED STATES, AUSTRALIA, CANADA OR JAPAN.
Continental European markets.
Source: SHOP APOTHEKE EUROPE.
THIS PRESENTATION AND ITS CONTENTS ARE NOT FOR RELEASE, PUBLICATION OR DISTRIBUTION, IN WHOLE OR IN PART, DIRECTLY OR INDIRECTLY, IN THE UNITED STATES, AUSTRALIA, CANADA OR JAPAN.
Farmaline brand.
“It´s great to be part of Europe´s leading OTC online pharmacy.”
Leen Ponet and Lode Fastré Founders of FARMALINE SHOP APOTHEKE EUROPE
THIS PRESENTATION AND ITS CONTENTS ARE NOT FOR RELEASE, PUBLICATION OR DISTRIBUTION, IN WHOLE OR IN PART, DIRECTLY OR INDIRECTLY, IN THE UNITED STATES, AUSTRALIA, CANADA OR JAPAN.
Type of Shares: Bearer shares Stock Exchange: Frankfurt Stock Exchange Market Segment: Regulated Market (Prime Standard) ISIN: NL0012044747 Number of shares outstanding: 9,069,878 Issue Price: € 28.00 Placement Volume: € 115m including Greenshoe
the Frankfurt Stock Exchange.
Source: SHOP APOTHEKE EUROPE.
THIS PRESENTATION AND ITS CONTENTS ARE NOT FOR RELEASE, PUBLICATION OR DISTRIBUTION, IN WHOLE OR IN PART, DIRECTLY OR INDIRECTLY, IN THE UNITED STATES, AUSTRALIA, CANADA OR JAPAN.
2015 showed strong growth
In 2016 profitable growth in the German core market continued and international sales more than tripled:
2016 international sales more than tripled,
in Austria and France and FARMALINE in Belgium, Italy and Spain.
International Germany Services including eliminations Germany
42,5
FY 2015 FY 2016
115.7 8.4 1.5 145.5 30.4 1.5
Source: SHOP APOTHEKE EUROPE.
125.6 177.4
THIS PRESENTATION AND ITS CONTENTS ARE NOT FOR RELEASE, PUBLICATION OR DISTRIBUTION, IN WHOLE OR IN PART, DIRECTLY OR INDIRECTLY, IN THE UNITED STATES, AUSTRALIA, CANADA OR JAPAN.
FY 2015 to € 29.6m in FY 2016. German gross margin increased from 20.1 % in FY 2015 to 20.4 % in FY 2016.
in 2015 to € 5.6m in 2016 due strong growth in Austria and France and the consolidation of Farmaline in Q4, with gross margin up from 15.0 % in 2015 to 18.4 % in 2016.
in 2015 and 2016.
Segment gross profit in € m 42,5
FY 2015 FY 2016
23.3 1.2 1.2 29.6 5.6 1.1
Source: SHOP APOTHEKE EUROPE. International Germany Services including eliminations Germany
25.7 36.3
THIS PRESENTATION AND ITS CONTENTS ARE NOT FOR RELEASE, PUBLICATION OR DISTRIBUTION, IN WHOLE OR IN PART, DIRECTLY OR INDIRECTLY, IN THE UNITED STATES, AUSTRALIA, CANADA OR JAPAN.
European markets including the new markets Italy and Spain.
Adjusted segment EBITDA in € m
Germany
4.0 0.8
FY 2016 FY 2015
International*
Germany Services
1.0 1.2
Source: SHOP APOTHEKE EUROPE. *adjusted for one-time costs related to the FARMALINE integration FY 2016 FY 2015 FY 2016 FY 2015
THIS PRESENTATION AND ITS CONTENTS ARE NOT FOR RELEASE, PUBLICATION OR DISTRIBUTION, IN WHOLE OR IN PART, DIRECTLY OR INDIRECTLY, IN THE UNITED STATES, AUSTRALIA, CANADA OR JAPAN.
well as regular seasonal year-end effects.
FARMALINE and € 20m short-term securities to avoid negative interest on cash.
and repayment of the shareholder loan are reflected in the cash-flow from financing.
31 October 2016 so that SHOP APOTHEKE EUROPE is now debt-free.
Development of cash (in € m)
Source: SHOP APOTHEKE EUROPE.
Cash as of 01/01/16
3.5 76.6 (17.2) (24.4) 38.5
Cash generated from financing activities Cash from Operating activities Cash used for investing and €20 m short-term securities Cash as of 31/12/16 (€58.5m including €20m short-term securities)
58.5
THIS PRESENTATION AND ITS CONTENTS ARE NOT FOR RELEASE, PUBLICATION OR DISTRIBUTION, IN WHOLE OR IN PART, DIRECTLY OR INDIRECTLY, IN THE UNITED STATES, AUSTRALIA, CANADA OR JAPAN.
* Net Working Capital increased due to build-up
at year-end.
Working capital (in € m, in % of revenue) 7.5
31/12/2015 31/12/2016
16.3
5.9 % 9.2 %*
Source: SHOP APOTHEKE EUROPE.
CAPEX (in € m) 4.1
31/12/2015 31/12/2016
12.0*
* Includes FARMALINE acquisition
Source: SHOP APOTHEKE EUROPE.
* Adjusted AE excludes one-off costs related to the IPO
2015 GERMANY INTERNATIONAL GERMANY SERVICES ELIMINATIONS CONSOLIDATED € '000 € '000 € '000 € '000 € '000 Revenue Cost of sales 115,660
8,425
3,398
125,578
Gross Profit % of revenue 23,277 20.1 % 1,262 15.0 % 3,103 91.3 %
25,737 20.5 % Other income Selling & Distribution 1,194
95
27
1,905 1,316
Segment EBITDA 841
1,194
Administrative expense Adjusted AE*
EBITDA Adjusted EBITDA
Depreciation and amortisation
EBIT Adjusted EBIT
Net finance cost and income tax
Net Loss Adjusted Net Loss
Source: SHOP APOTHEKE EUROPE.
* Adjusted S&D excludes one-off FARMALINE integration cost ** Adjusted AE excludes mostly one-off costs related to the IPO *** Excludes one-offs related to the shareholder loan repayment
2016 GERMANY INTERNATIONAL GERMANY SERVICES ELIMINATIONS CONSOLIDATED € '000 € '000 € '000 € '000 € '000 Revenue Cost of sales 145,549
30,376
4,108
177,391
Gross Profit % of revenue 29,640 20.4 % 5,599 18.4 % 3,685 89.7 %
36,282 20.5 % Other income Selling & Distribution Adjusted S&D* 1,810
363
31
2,641 2,641 2,204
Segment EBITDA Adjusted Segment EBITDA 3,992 4,030
975 975 231 1,066 Administrative expense Adjusted AE**
EBITDA Adjusted EBITDA
Depreciation
EBIT Adjusted EBIT
Net finance cost and income tax Adjusted net finance cost and income tax***
Net Loss Adjusted Net Loss
Source: SHOP APOTHEKE EUROPE.
YEAR ENDED 31 DEC 16 YEAR ENDED 31 DEC 15 € '000 € '000 Revenue Costs of sales 177,391
125,578
Gross profit 36,282 25,737 Other income Selling and Distribution Administrative Expense Result from operations 2,204
1,316
Finance income Finance expense Net finance cost 17
593
Result before tax
Income tax expenses 2,515
Loss for the year
Attributable to: Owners of the Company
Source: SHOP APOTHEKE EUROPE.
ASSETS 31 DEC 16 31 DEC 15 € '000 € '000 Non-current assets Property, plant and equipment Intangible assets 2,613 22,169 2,417 13,616 24,782 16,033 Current assets Inventories Pre-ordered stock Trade an other receivables Other current assets Other financial assets Cash and cash equivalents 18,841 6,823 8,278 3,130 20,012 38,485 10,412 5,653 4,100 3,046 3,529 95,569 26,739 Total Assets 120,351 42,772 EQUITY AND LIABILITIES 31 DEC 16 31 DEC 15 € '000 € '000 Shareholders´ equity Issued capital and share premium Reserves/accumulated loss 122,238
13,007
93,245 2,459 Provisions 2,961 Non-current liabilities Loan from related parties (shareholders) Deferred tax liability Other liabilities 3,334 19,002 2,564 3,000 3,334 24,566 Current liabilities Trade and other payables Amounts due to related parties Other liabilities 12,563 404 7,844 8,638 3,202 3,906 20,811 15,747 Total equity and liabilities 120,351 42,772
Source: SHOP APOTHEKE EUROPE. CASH FLOW FROM OPERATING ACTIVITIES 31 DEC 16 31 DEC 15 Operating result Adjustments for: – Depreciation and amortisation of non-current assets – Operationg result adjusted for depreciation and amortisation and provisions – Movements in working capitals:
Working capital movement
3,272
7,812
2,166
2,921 3,202
Cash generated from operations Interest received
17
Net cash (used in)/generated by operating activities
CASH FLOW FROM INVESTING ACTIVITIES Investment for property, plant and equipment Investment for intangible assets Investment for Farmaline acquisition Investment for other financial assets
Net cash (used in)/generated by investing activities
CASH FLOW FROM FINANCING ACTIVITIES Interest paid Shareholder Loan Repayment Net additional financing from related parties Capital increase Share issue from IPO Share issue cost Deposit from related parties and other non-current liabilities
10,008 100,000
334
14,011 3,000 Net cash (used in)/generated by financing activities 76,609 16,061 Net increase/(decrease) in cash and cash equivalents 34,956 3,232 Cash and cash equivalents at the beginning of the year 3,529 297 Cash and cash equivalents at the end of the year 38,485 3,529
THIS PRESENTATION AND ITS CONTENTS ARE NOT FOR RELEASE, PUBLICATION OR DISTRIBUTION, IN WHOLE OR IN PART, DIRECTLY OR INDIRECTLY, IN THE UNITED STATES, AUSTRALIA, CANADA OR JAPAN.
THIS PRESENTATION AND ITS CONTENTS ARE NOT FOR RELEASE, PUBLICATION OR DISTRIBUTION, IN WHOLE OR IN PART, DIRECTLY OR INDIRECTLY, IN THE UNITED STATES, AUSTRALIA, CANADA OR JAPAN.
THIS PRESENTATION AND ITS CONTENTS ARE NOT FOR RELEASE, PUBLICATION OR DISTRIBUTION, IN WHOLE OR IN PART, DIRECTLY OR INDIRECTLY, IN THE UNITED STATES, AUSTRALIA, CANADA OR JAPAN.
It is proposed to adopt the annual accounts 2015. A legal demerger (juridische afsplitsing) of EHS Europe Health Services B.V. resulted in the incorporation of Shop Apotheke Europe B.V. on 30 September 2015. Shop Apotheke Europe B.V. was converted into a public limited company (naamloze vennootschap) on 23 September 2016. Subsidiaries were acquired as part of the carve-out under common control. On 17 January 2017, the members of the managing board of the Company (the “Managing Board”) and the supervisory board of the Company (the “Supervisory Board”) signed the annual accounts 2015 of Shop Apotheke Europe B.V. drawn up by the Managing Board. Deloitte Accountants B.V., the Company’s external accountant, has issued an auditor's report with an unqualified audit opinion, which is included in the annual accounts for the financial year 2015. In order not to jeopardise the confidentiality of the IPO, the annual accounts 2015 could not be adopted in 2016.
THIS PRESENTATION AND ITS CONTENTS ARE NOT FOR RELEASE, PUBLICATION OR DISTRIBUTION, IN WHOLE OR IN PART, DIRECTLY OR INDIRECTLY, IN THE UNITED STATES, AUSTRALIA, CANADA OR JAPAN.
THIS PRESENTATION AND ITS CONTENTS ARE NOT FOR RELEASE, PUBLICATION OR DISTRIBUTION, IN WHOLE OR IN PART, DIRECTLY OR INDIRECTLY, IN THE UNITED STATES, AUSTRALIA, CANADA OR JAPAN.
It is proposed to adopt the annual accounts 2016. On 20 March 2017, the members of the Managing Board and the Supervisory Board signed the annual accounts 2016 drawn up by the Managing Board. The annual accounts were published on 27 March 2017 and are submitted for adoption by the general meeting in this annual general meeting. Deloitte Accountants B.V., the Company’s external accountant, has issued an auditor's report with an unqualified audit opinion, which is included in the annual accounts for the financial year
financial year 2016.
THIS PRESENTATION AND ITS CONTENTS ARE NOT FOR RELEASE, PUBLICATION OR DISTRIBUTION, IN WHOLE OR IN PART, DIRECTLY OR INDIRECTLY, IN THE UNITED STATES, AUSTRALIA, CANADA OR JAPAN.
THIS PRESENTATION AND ITS CONTENTS ARE NOT FOR RELEASE, PUBLICATION OR DISTRIBUTION, IN WHOLE OR IN PART, DIRECTLY OR INDIRECTLY, IN THE UNITED STATES, AUSTRALIA, CANADA OR JAPAN.
It is proposed to allocate the results for the financial year 2015 to the Company’s accumulated net loss. It is proposed to allocate the results for the financial year 2016 to the Company's accumulated net loss.
THIS PRESENTATION AND ITS CONTENTS ARE NOT FOR RELEASE, PUBLICATION OR DISTRIBUTION, IN WHOLE OR IN PART, DIRECTLY OR INDIRECTLY, IN THE UNITED STATES, AUSTRALIA, CANADA OR JAPAN.
THIS PRESENTATION AND ITS CONTENTS ARE NOT FOR RELEASE, PUBLICATION OR DISTRIBUTION, IN WHOLE OR IN PART, DIRECTLY OR INDIRECTLY, IN THE UNITED STATES, AUSTRALIA, CANADA OR JAPAN.
The discharge of the members of the Managing Board and the discharge of the members of the Supervisory Board are two separate items on the agenda. First, it is proposed to grant discharge to the members of the Managing Board for the management and conducted policy during the financial year 2016, insofar as the performance of such duties is disclosed in the annual accounts 2016 or has otherwise been disclosed to the general meeting.
THIS PRESENTATION AND ITS CONTENTS ARE NOT FOR RELEASE, PUBLICATION OR DISTRIBUTION, IN WHOLE OR IN PART, DIRECTLY OR INDIRECTLY, IN THE UNITED STATES, AUSTRALIA, CANADA OR JAPAN.
THIS PRESENTATION AND ITS CONTENTS ARE NOT FOR RELEASE, PUBLICATION OR DISTRIBUTION, IN WHOLE OR IN PART, DIRECTLY OR INDIRECTLY, IN THE UNITED STATES, AUSTRALIA, CANADA OR JAPAN.
It is proposed to grant discharge to the members of the Supervisory Board for their supervision on the (policies of) the Managing Board and the general course of affairs of the Company and its affiliated business during the financial year 2016, insofar as the performance of such duties is disclosed in the annual accounts 2016 or has otherwise been disclosed to the general meeting.
THIS PRESENTATION AND ITS CONTENTS ARE NOT FOR RELEASE, PUBLICATION OR DISTRIBUTION, IN WHOLE OR IN PART, DIRECTLY OR INDIRECTLY, IN THE UNITED STATES, AUSTRALIA, CANADA OR JAPAN.
THIS PRESENTATION AND ITS CONTENTS ARE NOT FOR RELEASE, PUBLICATION OR DISTRIBUTION, IN WHOLE OR IN PART, DIRECTLY OR INDIRECTLY, IN THE UNITED STATES, AUSTRALIA, CANADA OR JAPAN.
On 22 September 2016, the shareholders of Shop Apotheke Europe B.V. determined and approved that the remuneration of the members of the Supervisory Board is as follows: (a) the chairman of the Supervisory Board receives an annual retainer of EUR 30,000 for his/her services, (b) all other members of the Supervisory Board each receive EUR 20,000 annually for their services as of the date of their appointment and (c) any extraordinary travel expenses incurred by the members of the Supervisory Board when performing their services for the Company will be reimbursed by the Company. Given that the Company is now a listed entity, it is proposed to confirm the aforementioned existing remuneration of the members of the Supervisory Board.
THIS PRESENTATION AND ITS CONTENTS ARE NOT FOR RELEASE, PUBLICATION OR DISTRIBUTION, IN WHOLE OR IN PART, DIRECTLY OR INDIRECTLY, IN THE UNITED STATES, AUSTRALIA, CANADA OR JAPAN.
Pursuant to the Dutch Civil Code, the Company is required to inform the general meeting about the implementation of the remuneration policy for the Managing Board during the past financial year. The remuneration of the Managing Board had been determined by the shareholders of EHS Europe Health Services B.V. in 2012-2014 and by the shareholders of Shop Apotheke Europe B.V. since its incorporation in 2015. The Supervisory Board has prepared a remuneration policy, which was published on the website of the Company. It is proposed to adopt and implement the proposed remuneration policy for the members of the Managing Board for the financial year 2017.
THIS PRESENTATION AND ITS CONTENTS ARE NOT FOR RELEASE, PUBLICATION OR DISTRIBUTION, IN WHOLE OR IN PART, DIRECTLY OR INDIRECTLY, IN THE UNITED STATES, AUSTRALIA, CANADA OR JAPAN.
THIS PRESENTATION AND ITS CONTENTS ARE NOT FOR RELEASE, PUBLICATION OR DISTRIBUTION, IN WHOLE OR IN PART, DIRECTLY OR INDIRECTLY, IN THE UNITED STATES, AUSTRALIA, CANADA OR JAPAN.
It is proposed to appoint BDO Audit & Assurance B.V., Eindhoven, The Netherlands, as the external auditor charged with the auditing of the annual accounts for the financial year 2017.
THIS PRESENTATION AND ITS CONTENTS ARE NOT FOR RELEASE, PUBLICATION OR DISTRIBUTION, IN WHOLE OR IN PART, DIRECTLY OR INDIRECTLY, IN THE UNITED STATES, AUSTRALIA, CANADA OR JAPAN.
THIS PRESENTATION AND ITS CONTENTS ARE NOT FOR RELEASE, PUBLICATION OR DISTRIBUTION, IN WHOLE OR IN PART, DIRECTLY OR INDIRECTLY, IN THE UNITED STATES, AUSTRALIA, CANADA OR JAPAN.
It is proposed that the general meeting appoints the Managing Board for a period of five years as from the date of this meeting (i.e. up to and including 15 May 2022) as the corporate body authorised to issue shares and grant rights to acquire shares, up to a maximum of 20 % of the total number of issued shares outstanding on 1 January 2017, subject to the prior approval of the Supervisory Board.
THIS PRESENTATION AND ITS CONTENTS ARE NOT FOR RELEASE, PUBLICATION OR DISTRIBUTION, IN WHOLE OR IN PART, DIRECTLY OR INDIRECTLY, IN THE UNITED STATES, AUSTRALIA, CANADA OR JAPAN.
It is proposed that the general meeting appoints the Managing Board for a period of five years as from the date of this meeting (i.e. up to and including 15 May 2022) as the corporate body authorised to restrict and exclude the pre-emptive rights accruing to shareholders in respect of the issue of shares or the granting of rights to acquire shares as described in the previous proposal, subject to the approval of the Supervisory Board.
THIS PRESENTATION AND ITS CONTENTS ARE NOT FOR RELEASE, PUBLICATION OR DISTRIBUTION, IN WHOLE OR IN PART, DIRECTLY OR INDIRECTLY, IN THE UNITED STATES, AUSTRALIA, CANADA OR JAPAN.
THIS PRESENTATION AND ITS CONTENTS ARE NOT FOR RELEASE, PUBLICATION OR DISTRIBUTION, IN WHOLE OR IN PART, DIRECTLY OR INDIRECTLY, IN THE UNITED STATES, AUSTRALIA, CANADA OR JAPAN.
It is proposed that the general meeting authorises the Managing Board to repurchase shares, on the stock exchange or otherwise, for a period of 18 months as from the date of this meeting (i.e. up to and including 15 January 2019), up to a maximum of 10% of the total number of issued shares outstanding on 1 January 2017, provided that the Company will not hold more shares in treasury than a maximum 10% of the issued and outstanding share capital at any given time. The repurchase can take place at a price between the nominal value of the shares and the weighted average price on the Xetra trading venue at the Frankfurt Stock Exchange for five trading days prior the day of purchase plus 10%. This price range enables the Company to adequately repurchase its own shares, also in volatile market conditions.
THIS PRESENTATION AND ITS CONTENTS ARE NOT FOR RELEASE, PUBLICATION OR DISTRIBUTION, IN WHOLE OR IN PART, DIRECTLY OR INDIRECTLY, IN THE UNITED STATES, AUSTRALIA, CANADA OR JAPAN.
THIS PRESENTATION AND ITS CONTENTS ARE NOT FOR RELEASE, PUBLICATION OR DISTRIBUTION, IN WHOLE OR IN PART, DIRECTLY OR INDIRECTLY, IN THE UNITED STATES, AUSTRALIA, CANADA OR JAPAN.