
SLIDE 1
Vehicular Carriers: When Data Meet the Road1
Prométhée Spathis, UPMC Marcelo Dias de Amorim, Raul A. Gorcitz, Yesid Jarma, Serge Fdida, UPMC Ryuji Wakikawa,Toyota ITC John Whitbeck, Vania Conan, Thales
1 Vehicular Carriers for Big Data Transfers, in Proc. of IEEE VNC2012, Nov 2012, Seoul Korea
Why Study Vehicules?
- Present in large numbers
– Already surpassed 1 billion mark (2010) – Expected to double in the next two decades
- Mobile by nature, obviously
– Transportation of goods and people – Public vehicles as urban sensors
- Well instrumented and connected
– Sensors, communication devices and computing units – Already exploited by manufactures to provide advanced services
2
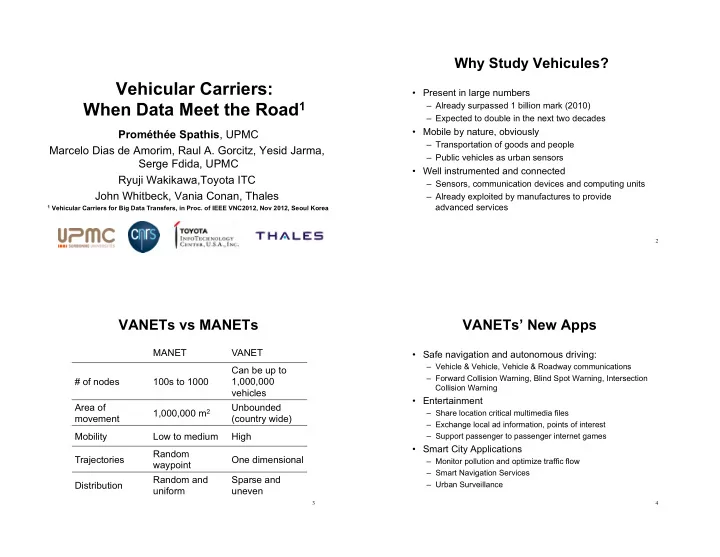
VANETs vs MANETs
3
MANET VANET # of nodes 100s to 1000 Can be up to 1,000,000 vehicles Area of movement 1,000,000 m2 Unbounded (country wide) Mobility Low to medium High Trajectories Random waypoint One dimensional Distribution Random and uniform Sparse and uneven
VANETs’ New Apps
- Safe navigation and autonomous driving:
– Vehicle & Vehicle, Vehicle & Roadway communications – Forward Collision Warning, Blind Spot Warning, Intersection Collision Warning
- Entertainment
– Share location critical multimedia files – Exchange local ad information, points of interest – Support passenger to passenger internet games
- Smart City Applications
– Monitor pollution and optimize traffic flow – Smart Navigation Services – Urban Surveillance
4