vegetation lateral selection methodology comparison 1
play

Vegetation Lateral Selection Methodology Comparison (1) Lateral - PowerPoint PPT Presentation

Vegetation Lateral Selection Methodology Comparison (1) Lateral selection vs. (2) Substation holistic selection Both methodologies leverage sigma level (z-Score) performance of laterals (weighted function) Accounts for last-trim date to


  1. Vegetation Lateral Selection Methodology Comparison (1) Lateral selection vs. (2) Substation holistic selection • Both methodologies leverage sigma level (z-Score) performance of laterals (weighted function) • Accounts for last-trim date to maintain the 3/6 cycle Method Comparison 
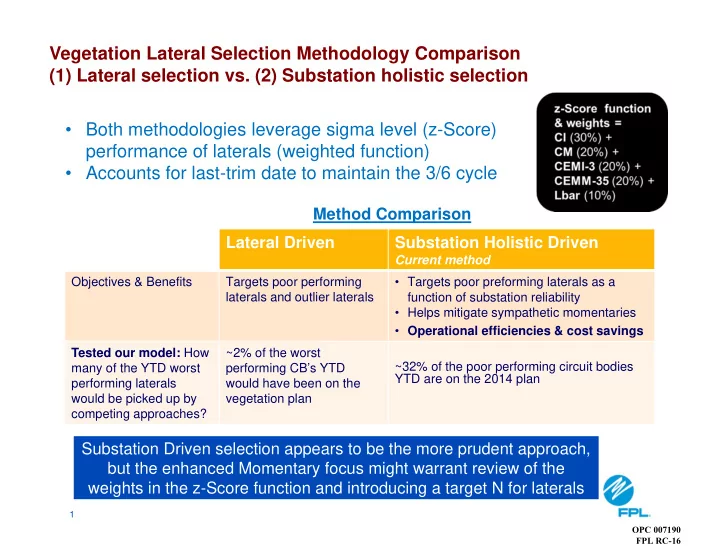
Lateral Driven Substation Holistic Driven Current method Objectives & Benefits Targets poor performing • Targets poor preforming laterals as a laterals and outlier laterals function of substation reliability • Helps mitigate sympathetic momentaries • Operational efficiencies & cost savings Tested our model: How ~2% of the worst ~32% of the poor performing circuit bodies many of the YTD worst performing CB’s YTD YTD are on the 2014 plan performing laterals would have been on the would be picked up by vegetation plan competing approaches? Substation Driven selection appears to be the more prudent approach, but the enhanced Momentary focus might warrant review of the weights in the z-Score function and introducing a target N for laterals 1 OPC 007190 FPL RC-16

  2. Vegetation Lateral N Comparison March YTD Lateral Vegetation Interruptions Month 2010 2011 2012 2013 2014 Jan 278 247 183 140 262 Feb 253 158 203 189 210 Mar 315 578 347 202 386 MAR 846 983 733 531 858 YTD Despite the spike in Mar YTD 2014 compared to prior downward 3 year 12MOE trend 313 Circuit bodies representing 386 N Identified: • 30% (100) Circuit bodies representing 116 N (30%) are on the 2014 plan or trimmed in the prior two years. • The remaining (70%) circuit Bodies representing 270 N were trimmed in 2011 or prior • Of the 2014 work, 14% are complete and 6% are in progress **Note: Units trimmed in 2012 or later were not eligible for 2014 Trimming 30% of CB are on 2014 plan representing 2 OPC 007191 FPL RC-16

  3. We have met our obligation to ramp up our lateral miles execution to 1/6 while keeping our feeder miles steady at 1/3 Selection criteria devised to gain additional reliability benefits and operational efficiencies while meeting regulatory commitments. 2014 Plan was reviewed with each Management area in October. Refinement meetings with each Management area have been completed to this week to respond to the recent reliability patterns 3 OPC 007192 FPL RC-16

  4. Volume & Cause Code Veg Volume & Cause Code Trending of Q1 Lateral Interruptions - 2009 thru 2014 Lateral VEG interruptions volume trending observations: Q1’s 2009 to present? • Preventable & Unpreventable categories experienced double digit increases or decreases in year over year failure rates, suggesting significant volatility ( why? ). Preventable consistently high bar. • Y12 and Y13 showed the most marked improvement, coinciding with the two highest years of lateral mile trimming from ’06 – ‘13 period. Note that Y14 lateral mileage plan is only slightly Regional below Y12 (3,675 mi). • Proportions of Preventable VEG dropped to 70% in Q1 ‘14, and improvement over Q1 ’13 while Unpreventable increased to 25% (+4%) Wind Speed Critical to Veg Q1’s Veg Interruptions 2009 to present % YOY Change TOTAL N % of Tot Y09 - Y10 Y10 - Y11 Y11 - Y12 Y12 - Y13 Y13 - Y14 Row Labels '09 '10 '11 '12 '13 '14 '09 '10 '11 '12 '13 '14 A 67% 9% -19% -24% 54% Tree/Limb Prev 248 444 493 395 313 522 67% 69% 64% 69% 73% 70% 70% 35% -42% -40% 94% Tree/Limb Unprev 105 178 259 158 92 189 29% 28% 34% 27% 21% 25% 8% 10% 0% -16% 47% Vines/Grass 15 18 14 22 24 34 4% 3% 2% 4% 6% 5% 64% 16% -25% -28% 62% Grand Total 368 640 766 575 429 745 100% 100% 100% 100% 100% 100% Significant historical swings in failure rates for Q1 lateral Vegetation interruptions 4 OPC 007193 FPL RC-16

  5. Volume & Cause Code Where are preventable lateral N’s occurring? A VEG Preventable Lateral N’s TOTAL N % of Tot Row Labels '09 '10 '11 '12 '13 '14 '09 '10 '11 '12 '13 '14 Dade 21 42 39 48 44 80 8% 9% 8% 12% 14% 15% East 47 79 79 75 52 132 19% 18% 16% 19% 17% 25% North 89 166 207 159 119 160 36% 37% 42% 40% 38% 31% West 91 157 168 113 98 150 37% 35% 34% 29% 31% 29% Grand Total 248 444 493 395 313 522 100% 100% 100% 100% 100% 100% Regional Are proportions out of line with historical? Wind Speed Critical to Veg YES, Dade & East higher than expected 5 OPC 007194 FPL RC-16

  6. Volume & Cause Code Veg Proportion of Q1 Lateral Interruptions - 2009 thru 2014 • Vegetation’s proportion of lateral N is back to 2011 level after two consecutive Q1’s dropping. • Chi-square indicates that proportion of VEG and WEATHER related cause codes for lateral N is markedly higher than expected in 2014. Regional TOTAL N % of Tot Row Labels 2009 2010 2011 2012 2013 2014 2009 2010 2011 2012 2013 2014 Accident 72 58 47 62 58 64 4% 2% 2% 3% 3% 3% Animal 118 139 165 128 148 122 7% 6% 7% 6% 8% 5% Equipment Failure 465 628 416 520 386 500 28% 26% 17% 26% 21% 21% Improper Process 69 133 73 67 67 78 4% 6% 3% 3% 4% 3% Wind Speed Critical to Veg Not Available 2 1 0% 0% 0% 0% 0% 0% Other 105 115 106 96 149 147 6% 5% 4% 5% 8% 6% Request 170 135 112 142 121 151 10% 6% 5% 7% 7% 6% Unknown 156 342 369 282 325 325 9% 14% 15% 14% 18% 14% Veg & Weather Vegetation 368 640 766 575 429 745 22% 27% 31% 28% 24% 31% Cause Codes - Weather 148 219 429 158 114 258 9% 9% 17% 8% 6% 11% Higher than Grand Total 1671 2409 2485 2031 1797 2390 100% 100% 100% 100% 100% 100% expected proportion in 2014 6 OPC 007195 FPL RC-16

  7. Veg Volume & Cause Code Trending of Q1 Lateral Volume & Cause Code Interruptions - 2009 thru 2014 Row Labels 2009 2010 2011 2012 2013 2014 Y09 - Y10 Y10 - Y11 Y11 - Y12 Y12 - Y13 Y13 - Y14 Dade 45 74 62 90 65 128 64% -16% 45% -28% 97% East 95 143 153 151 95 192 51% 7% -1% -37% 102% North 211 362 483 315 220 320 72% 33% -35% -30% 45% West 166 267 285 177 151 220 61% 7% -38% -15% 46% Grand Total 517 846 983 733 531 860 64% 16% -25% -28% 62% Regional • All areas have experienced double digit growth in Veg Lateral interruptions in Q1. • The last time that happened was in Y10 Perhaps volumes are up but proportions are Wind Speed Critical to Veg consistent with historical? NO • Chi-square indicates that proportion of lateral N is markedly higher than expected in both Higher than expected Dade and East in 2014 vs. other areas. proportion in 2014 Dade & East palm management programs and target trimming are being reviewed to identify opportunities for surgical funding & strengthening 7 OPC 007196 FPL RC-16

  8. With so much uptick in Dade, let’s look at how the mean Volume & Cause Code windspeeds at Miami Airport (proxy) compare across Jan, Feb, March to see if there is anything noteworthy… > Miami Airport wind patterns are generally back to what they were in prior years (2013 mildest March) Regional > If we assume (big assumption) that Dade is a good proxy, and on balance ‘14 has not been windier than ‘13, how then do we explain such a systemic uptick in veg… very strange Wind Speed Critical to Veg Jan ’13 Feb ’13 Mar ’14 windier windier windier than Jan than Feb than Mar ‘14 ‘14 ‘13 8 OPC 007197 FPL RC-16

  9. Vital feeder work for this year, from a VEG perspective, is 53% Complete or In Progress 91 feeders, so far, represent the synthesis of the 77 CEMM35 and 57 Chronic feeders from this year and VEG will have ALL completed by 6/1 9 OPC 007198 FPL RC-16

Download Presentation
Download Policy: The content available on the website is offered to you 'AS IS' for your personal information and use only. It cannot be commercialized, licensed, or distributed on other websites without prior consent from the author. To download a presentation, simply click this link. If you encounter any difficulties during the download process, it's possible that the publisher has removed the file from their server.

Recommend


More recommend