
SLIDE 1
11/18/2019 1 FY2021 Commission Planning Workshop
November 18, 2019
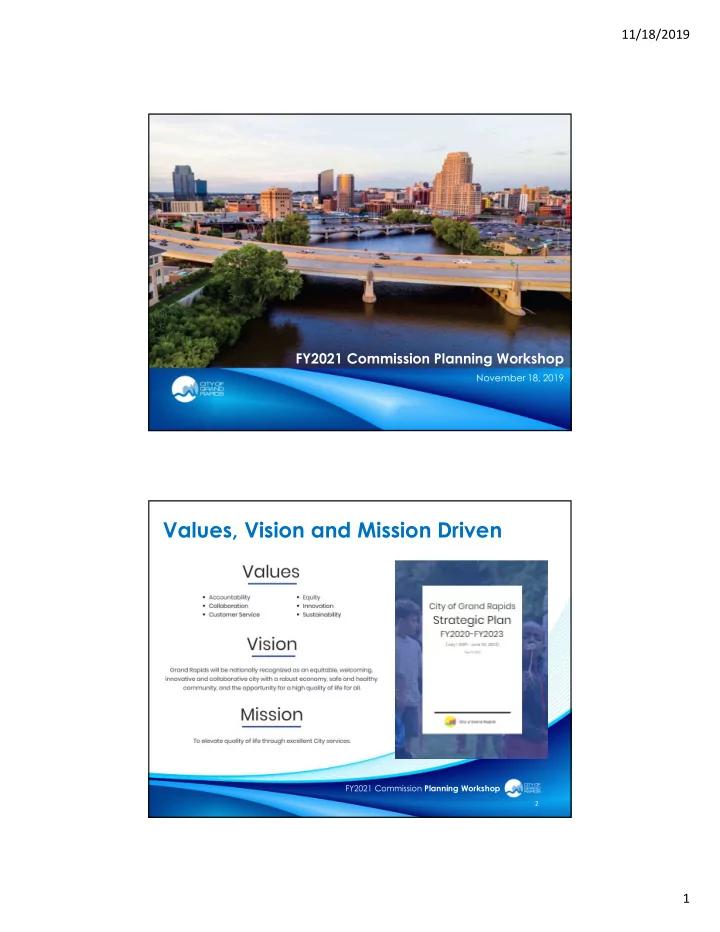
Values, Vision and Mission Driven
FY2021 Commission Planning Workshop
2
Values, Vision and Mission Driven FY2021 Commission Planning Workshop - - PDF document
11/18/2019 FY2021 Commission Planning Workshop November 18, 2019 Values, Vision and Mission Driven FY2021 Commission Planning Workshop 2 1 11/18/2019 Agenda Items Reflecting on the success of the last year FY2019 Financial Performance
November 18, 2019
FY2021 Commission Planning Workshop
2
3
FY2021 Commission Planning Workshop
Monday, Nov. 18* FY2021 Planning Workshop (noon – 4:30 pm) Tuesday, Feb. 25* FY2020 Performance Management Midyear Update (1 – 4pm) (tentative) Tuesday, Apr. 28 FY2021 Preliminary Fiscal Plan presentation Tuesday, May 5* Budget Review Workshop (9 am – noon) Tuesday, May 12* Budget Review Workshop (1 – 4pm) Tuesday, May 19 Committee of the Whole Discussion (9:30 am) Public Hearing at City Commission (7 pm) Thursday, May 21* Deliberation and City Commission Adoption (9 – 11 am)
4
FY2021 Commission Planning Workshop * Special meetings to be scheduled
Category Amended Budget Budget Estimate Actual Variance From Estimate – Favorable (Unfavorable) Revenues $143,248,084 $144,781,794 $149,539,443 $4,757,649 Expenditures $143,653,738 $143,224,941 $142,378,762 $846,179 FY19 Revenue Over/(Under) Expenditures ($405,654) $1,556,853 $7,160,681 $5,603,828
6
FY2021 Commission Planning Workshop
Category FY2019 Actual FY2020 Re- appropriations & Carry-forwards FY2020 Budget Revised FY2020 Estimate Change in Unassigned Fund Balance from FY2020 Fiscal Plan Revenues $149,539,443
$150,796,232 $150,796,232 N/A Expenditures $142,378,762 $284,516 $147,831,777 $148,116,293 N/A Change in Fund Balance $7,160,681 ($284,516) $2,964,455 $2,679,939 N/A Beginning Fund Balance $30,434,665 N/A $31,991,518 $38,134,167 N/A Net Change to Receivables / Payables $538,821 N/A N/A N/A N/A Ending Fund Balance $38,134,167 N/A $34,955,973 $40,814,106 $5,858,133
7
FY2021 Commission Planning Workshop
Fund Target Goal Target $ (based on FY2019 Actuals) FY2019 Actual Actual %
Operating Expenses % of Target Achieved General Fund 15% of Operating Expenses $21,356,814 $38,134,167 26.8% 178.56% Budget Stabilization Fund 10% of Operating Expenses $14,237,876 $14,298,835 10.0% 100.43%
8
FY2021 Commission Planning Workshop
9
*Based on Revised FY2020 Projections FY2021 Commission Planning Workshop
11.70% 12.50% 7.20% 10.60% 11.60% 12.20% 16.90% 20.50% 22.50% 26.80% 3.10% 5.00% 7.20% 10.10% 9.70% 10.70% 10.00% 0.00% 5.00% 10.00% 15.00% 20.00% 25.00% 30.00% FY10 FY11 FY12 FY13 FY14 FY15 FY16 FY17 FY18 FY19
General Fund Unassigned FB% Budget Stabilization FB%
10
Target Goals: GOF- 15% BSF- 10% FY2021 Commission Planning Workshop
$12.75 $13.86 $8.70 $12.68 $13.84 $15.10 $22.39 $27.29 $30.43 $38.13 $3.68 $5.94 $8.95 $12.95 $12.95 $14.30 $14.30 $0.00 $5.00 $10.00 $15.00 $20.00 $25.00 $30.00 $35.00 $40.00 $45.00 FY10 FY11 FY12 FY13 FY14 FY15 FY16 FY17 FY18 FY19
Millions Fiscal Year Ending June 30
Unassigned GOF Fund Balance Budget Stabilization Fund Balance
11
FY2021 Commission Planning Workshop
Category FY2019 Estimate FY2019 Actuals Difference from Estimate
Income Taxes $85,229,144 $86,933,201 $1,704,057 Property Taxes $11,904,349 $12,177,333 $272,984 Property Tax Admin. Fee $1,955,365 $2,116,151 $160,786 Total Taxes $99,088,858 $101,226,685 $2,137,827
12
FY2019 Estimated Income Tax Growth FY2019 Actual Income Tax Growth % Growth In Income Taxes (Citywide)
4.50% 6.62%
FY2021 Commission Planning Workshop
$4,412,661 $2,388,240 $1,066,822 $- $2,699,407 $4,564,650 $2,163,363 $1,266,467 $6,713,466 $3,645,493 $- $1,000,000 $2,000,000 $3,000,000 $4,000,000 $5,000,000 $6,000,000 $7,000,000 $8,000,000
Code Enforcement Fees Electric Power Distribution Central Service Charges (A- 87) Other
FY2019 Estimate FY2019 Actuals
13
FY2021 Commission Planning Workshop
14 $19,608,332 $9,362,552 $20,277,262 $2,740,906 $- $5,000,000 $10,000,000 $15,000,000 $20,000,000 $25,000,000 Intergovernmental Other Financing Sources
FY2019 Estimate FY2019 Actuals FY2021 Commission Planning Workshop
15
$2,689,597 $2,100,000 $864,886 $500,439 $2,550,097 $1,853,968 $2,027,865 $509,221 $- $500,000 $1,000,000 $1,500,000 $2,000,000 $2,500,000 $3,000,000 Licenses & Permits Fines & Forfeitures Interest & Rents Other Revenue
FY2019 Estimate FY 2019 Actuals
FY2021 Commission Planning Workshop
16 Fiscal Admin, $(44,516) General Admin, $(1,539,371) Budget Office, $4,936 Purchasing, $(9,093) Income Tax, $(299,632) Assessor, $(183,445) Comptrollers, $(335,776) Enterprise Services, $(318,406) Police, $325,482 Fire, $(494,689) Community Dev, $5,571 Executive Office, $(1,541,730) Attorney's Office, $(341,593) Treasury, $(34,487) Planning, $(69,617) Code Compliance, $(120,335) Clerk, $(61,311) Info Tech, $3,934 Human Resources, $(184,856) Admin Svcs, $(36,041) $(2,000,000) $(1,500,000) $(1,000,000) $(500,000) $- $500,000
FY2021 Commission Planning Workshop
17
Appropriation Lapse History Summary
Fiscal Year Adopted Budget Assumed Lapse Assumed Lapse % of Adopted Budget Recognized Lapse Recognized Lapse %
FY2020 147,831,777 $ 4,000,000 $ 2.71% N/A N/A FY2019 142,683,745 $ 4,000,000 $ 2.80% 5,274,976.00 $ 3.70% FY2018 137,112,916 $ 3,500,000 $ 2.55% 6,441,791.00 $ 4.70% FY2017 132,858,741 $ 3,500,000 $ 2.63% 4,721,399.00 $ 3.55% FY2016 125,374,235 $ 3,500,000 $ 2.79% 3,874,283.00 $ 3.09% FY2015 122,003,869 $ 3,000,000 $ 2.46% 4,350,648.00 $ 3.57% Most Recent 5 Year Average Recognized Lapse: 4,932,619.40 $ 3.72% FY2021 Commission Planning Workshop
18
FY2021 Commission Planning Workshop
service:
FY2019-20 Supplemental State Funding
and bridges
funding in FY2020.
remaining $25 million into transit programs.
19
FY2021 Commission Planning Workshop 20
FY2020:
dollars
Bond Series Amount Issued Retirement Date 2014 $17 million October 2017 2015 $15 million August 2020 2016 $15.245 million April 2026
FY2021 Commission Planning Workshop
the GOF in the amount of $6,163,056
additional $4.7 million planned in FY2020
million has been appropriated in FY2020 for park investments.
straddling two fiscal periods.
renovated trails, new picnic shelters, new restrooms, new site amenities and improved landscaping
21
FY2021 Commission Planning Workshop
FY2022 as the seven-year Parks Millage ends
annually for pool operations and approximately $3 million annually for park improvement projects
ballot proposal that will provide dedicated funding for parks, pools, and playgrounds.
in the first year to be dedicated to the parks system.
identify how the parks millage can be invested and commits to maintaining General Operating Fund support.
22
FY2021 Commission Planning Workshop
23
State Shared Revenue
($476,652 increase) Property taxes – Meeting forecasts Personnel
job training initiatives, etc. was either vetoed or redirected
sick leave improvements Capital Asset Management
business units
reduced to 4.25% down from 4.5% in FY2018 and 5% in FY2017
FY2021 Commission Planning Workshop
24
YR TO DATE YR TO DATE YR TO DATE YR TO DATE
FY 2019 FY 2020 FY 2019 FY 2020 DIFFERENCE % 4/EOM 8/31/2018 8/31/2019 6,123,358.73 5,416,806.07 (706,552.66)
8/EOM 9/28/2018 9/30/2019 13,983,370.60 16,393,421.72 2,410,051.12 17.24% 9 10/5/2018 10/4/2019 16,012,995.14 17,039,256.06 1,026,260.92 6.41% WEEK
WEEK ENDING CITY OF GRAND RAPIDS INCOME TAX DEPARTMENT NET INCOME TAX RECEIPTS CUMULATIVE TO DATE FY 2019 to FY 2020 (100% OF INCOME TAX RECEIPTS LESS REFUNDS PLUS PENALTY AND INTEREST)
FY2021 Commission Planning Workshop
2021 Grand Rapids-Wyoming change in real GDP was 3.3% in 2017
2021) Grand Rapids-Wyoming unemployment rate as of August 2019 is 2.9%*
FY2018, respectively)
core inflation will continue to run higher, at about 2.5%).
tensions.
as the next 12-18 months. *Smoothed seasonally adjusted
25
FY2021 Commission Planning Workshop
Property Taxes
State Shared Revenue
26 $10,000,000 $15,000,000 $20,000,000 $25,000,000 $30,000,000 FY02 FY03 FY04 FY05 FY06 FY07 FY08 FY09 FY10 FY11 FY12 FY13 FY14 FY15 FY16 FY17 FY18 FY19 FY20 (Est.)
State Shared Revenues
FY2021 Commission Planning Workshop
type plans
three defined benefit retiree healthcare plans
Affordable Care Act “Cadillac Tax” within the June 30, 2018 Actuarial Valuations
whose value exceeds predetermined threshold amounts
impacted if this tax were enacted
is currently scheduled to be enacted in 2022
2020 should further reduce contributions for the retiree healthcare defined benefit plans in the future
27
FY2021 Commission Planning Workshop
28 Description General (7371) Police (7372) Fire (7373) Library (7374) Total Funds
Net Position a/o June 30, 2018 10,586,168 $ 33,750,459 $ 19,156,718 $
63,493,346 $ Employer Contributions 5,742,193 $ 4,099,293 $ 2,945,869 $ 25,191 $ 12,812,546 $ Retiree Contributions 653,359 $ 360,192 $ 326,936 $ 2,634 $ 1,343,121 $ Net Interest Earnings 14,106 $ 8,959 $ 6,904 $
29,969 $ Investment Earnings 368,584 $ 1,055,346 $ 580,072 $
2,004,002 $ Miscellaneous Expenses (161,545) $ (142,446) $ (116,428) $
(420,420) $ Claims Paid (4,301,655) $ (2,560,262) $ (2,501,101) $ (27,825) $ (9,390,843) $ Net Position a/o June 30, 2019 12,901,210 $ 36,571,540 $ 20,398,971 $
69,871,721 $ 2019 DC contributions
973,692 $ 272,857 $ 108,691 $ 70,803 $ 1,426,043 $
City of Grand Rapids Summary of Defined Benefit Retiree Health Care Funds Fiscal Year Ending June 30, 2019
6/30/2019 (down from $104 million in FY2017 and $216 million in FY2009)
FY2021 Commission Planning Workshop
between the valuation date and the date to which contribution rates apply from 6 months to 18 months for the Police & Fire Retirement System
predictable and more challenging to earn expected rate of return
29
Actuarial Actuarial Value
Actuarial Accrued Liability (AAL) Unfunded AAL (UAAL) Funded Ratio Contribution ** Blended Contribution ** Valuation Date
(a) (b) (b-a) (a / b) % % General Retirement System June 30, 2015 401,743,923 $ 500,205,954 $ 98,462,031 $ 80% 29.15% 23.03% June 30, 2016 404,096,873 $ 510,324,266 $ 106,227,393 $ 79% 32.85% 23.89% June 30, 2017 418,027,055 $ 517,035,103 $ 99,008,048 $ 81% 32.25% 22.23% June 30, 2018 426,989,004 $ 526,954,073 $ 99,965,069 $ 81% 34.74% 21.93% June 30, 2019* 38.00% * Police & Fire Retirement System December 31, 2015 386,363,384 $ 461,091,743 $ 74,728,359 $ 84% 23.27% N/A December 31, 2016 399,808,165 $ 479,362,227 $ 79,554,062 $ 83% 23.59% N/A December 31, 2017 421,679,693 $ 506,255,138 $ 84,575,445 $ 83% 23.71% N/A December 31, 2018 425,207,986 $ 527,629,168 $ 102,421,182 $ 81% 24.95% N/A
* Projection per June 30, 2018 51st Annual Actuarial Valuation Report (Page A-5) ** Two-year lag between fiscal plan year and valuation date year (i.e., FY2019 fiscal plan utilizes June 30, 2017 valuation date rate) City of Grand Rapids DB Retirement Plans Summary
FY2021 Commission Planning Workshop
New Three-Year Contracts
2022) for third-party administrators of the City’s Unified Health Care Plan
Other Considerations
30
FY2021 Commission Planning Workshop
2020 rate decrease due to:
inadvertently excluded in the past
prescription industry trends
City’s healthcare fund
with the new administrators
31
FY2021 Commission Planning Workshop
adjusting for one-time and/or temporary revenue streams by $6.3 million
budget among all three defined benefit retiree healthcare plans
and fair goals of the Sustainable Streets Task Force ($6 million annually)
expansion period in history
32
FY2021 Commission Planning Workshop
33
FY2021 Commission Planning Workshop
34
Category FY2019 Actual FY2020 Adopted FY2021 Forecast FY2022 Forecast FY2023 Forecast FY2024 Forecast Revenues $13,494,673 $13,149,530 $13,454,317 $13,977,932 $14,074,595 $14,318,514 Expenditures $11,931,965 $14,990,268 $14,186,654 $13,382,778 $12,908,717 $15,488,053 Change in Fund Balance $1,562,709 ($1,840,738) ($732,337) $595,155 $1,165,878 ($1,169,539) Beginning Fund Balance $1,436,633 $2,999,341 $1,158,603 $426,267 $1,021,422 $2,187,300 Ending Fund Balance $2,999,341 $1,158,603 $426,267 $1,021,422 $2,187,300 $1,017,761 Minimum Fund Balance $1,000,000 $1,000,000 $1,000,000 $1,000,000 $1,000,000 $1,000,000 Capacity $1,999,341 $158,603 ($573,733) $21,422 $1,187,300 $17,761 FY2021 Commission Planning Workshop
35
FY2021 Commission Planning Workshop
36
Monday, Nov 18 FY2021 Planning Workshop Tuesday, Apr 28 City Manager presents FY2021 Prelim Fiscal Plan to City Commission Tuesday, May 5 City Commission Begins Budget Submittal Review Tuesday, May 12 Set Public Hearing for proposed FY2021 Millage and Budget Tuesday, May 19 Hold Public Hearing for proposed FY2021 Millage and Budget Thursday, May 21 Resolution to Adopt FY2021 Millage and Budget Wednesday, July 1 2021 Fiscal Year begins
FY2021 Commission Planning Workshop
37
A fiscally resilient government powered by high performing and knowledgeable staff equipped with the appropriate tools and resources to offer excellent, equitable and innovative public service.
39 40
O1 Embedding Equity
that advance equity
O2 Fiscal Sustainability
water/sewer funds
healthcare funds
FY2021 Commission Planning Workshop
41
O3 Employees
insurance and sick leave improvements
O4 Facilities/Workspaces
room in City Hall
FY2021 Commission Planning Workshop
42
O5 Technology, Performance Management, Internal Communications and Data
management infrastructure
O6 Master Plan
Southtown Business Area Specific Plan
FY2021 Commission Planning Workshop
43
509 Wealthy) (O4)
FY2021 Commission Planning Workshop
44
FY2021 Commission Planning Workshop
All people feel safe and are safe at all times throughout
45 46
FY2021 Commission Planning Workshop
O1 Emergency Preparedness
increase security to critical systems accessed remotely or via cloud-based services
O2 Emergency Response
O3 Recovery from Emergencies
September 2019 extreme weather event
47
O4 Community Oriented Policing
promoted 11 police officers
Specialist, Special Services Unit Officer, Property Management Unit Officer)
and named an Interim Director
Design (CPTED) ordinance and strategy
O5 Safe, Stable and Permanent Housing
FY2021 Commission Planning Workshop
48
FY2021 Commission Planning Workshop
49
FY2021 Commission Planning Workshop
Innovative, efficient and equitable mobility solutions are safe, affordable and convenient to the community.
50
51
O1 Multi-modal Transportation
projects (Skyline and 3 Mile)
riders)
O2 21st Century Mobility Options
to improve Go!Bus service
FY2021 Commission Planning Workshop
52
O3 Parking
spaces at 601 Ottawa
parking spaces downtown, with potential for additional commercial or residential development
O4 Transportation Network
57.1% from 60.6% in 2018
leveraged an additional $14.15 million
workgroup held 20 focus groups to test a series of draft
FY2021 Commission Planning Workshop
53
FY2021 Commission Planning Workshop
54
FY2021 Commission Planning Workshop
Residents, employees and businesses have pathways to financial growth and security.
55 56
O1 Business Services
customers to submit plans electronically and view comments from plan reviewers online
O2 Business Growth
MEDC and the Right Place to bring 400 jobs downtown
studio, housing, retail, hotel and 900+ parking spaces
commission retail market study and retain a retail specialist
FY2021 Commission Planning Workshop
57
O2 Business Growth (cont'd)
Transformation and Innovation Center in the North Monroe area – 1,200 employees
O3 Resident Education/Employment/Wage Growth
100 businesses
through college
MOU with Grand River White Water and a MOA with GRWW, GLFC and US FWS
FY2021 Commission Planning Workshop
58
O4 Housing
efforts and partnered with GRACC and Frey Foundation for a Housing Needs Assessment
Bank
awards with the City’s Strategic Plan priorities
Recommendations
158 units of affordable housing
FY2021 Commission Planning Workshop
59
O5 Destination City
$5 million for the West Michigan Amphitheatre
Places by the American Planning Association
feasibility of a convention center hotel and amphitheater
FY2021 Commission Planning Workshop
60
FY2021 Commission Planning Workshop
61
FY2021 Commission Planning Workshop
The health of all people and the environment are advocated for, protected and enhanced.
62
63
O1 Carbon Emissions, Climate Resiliency
zoning ordinance to make it easier for residents to install solar
development at Butterworth Landfill
O2 Green Spaces/Recreational Activities
connectivity to 245-mile rail-trail network
Reservoir parks
Riverside and Ken-O-Sha parks
FY2021 Commission Planning Workshop
64
O3 Water Resources
service lines
findings of regulated contaminants
country)
O4 Minimize Waste Generation and Promote Diversion
construction contract
Public Works
FY2021 Commission Planning Workshop
65
O5 Health Disparities
$4.2 million HUD Lead Hazard Control Grant
County Health and other organizations
reporting with Seamless, Start Garden and GVSU
FY2021 Commission Planning Workshop
66
improvements) (O2)
FY2021 Commission Planning Workshop
67
FY2021 Commission Planning Workshop
Residents and stakeholders have awareness of and voice in decisions that affect them, and receive culturally responsive and proactive communication.
68
69
O1 Enhance Communication
restoration, 2020 census, lead awareness, human trafficking)
media inquiries in order to better achieve our goal of one city,
data modules to enhance public transparency
O2 Community Engagement Strategy
census efforts
equity/engagement partner for the Zero Cities project
FY2021 Commission Planning Workshop
70
O3 Gauge/Enhance Community Perception
make recommendations on resident-led proposals
O4 Elevate Resident Voice
Neighborhood Association and visioning for the MLK Park Lodge
through Neighborhood Leadership Academy
improved election services
FY2021 Commission Planning Workshop
71
for engagement, including technology (O2)
(O3)
FY2021 Commission Planning Workshop
72
FY2021 Commission Planning Workshop
FY2021 Commission Planning Workshop
74