
SLIDE 1
Value of Choices
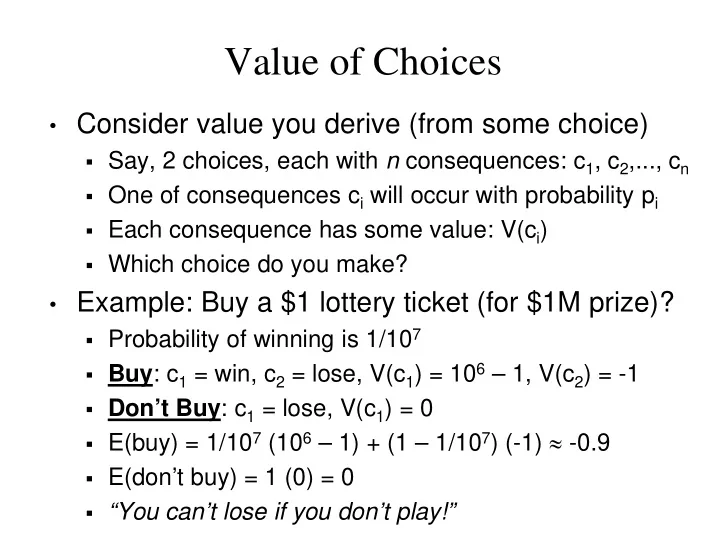
- Consider value you derive (from some choice)
- Say, 2 choices, each with n consequences: c1, c2,..., cn
- One of consequences ci will occur with probability pi
- Each consequence has some value: V(ci)
- Which choice do you make?
- Example: Buy a $1 lottery ticket (for $1M prize)?
- Probability of winning is 1/107
- Buy: c1 = win, c2 = lose, V(c1) = 106 – 1, V(c2) = -1
- Don’t Buy: c1 = lose, V(c1) = 0
- E(buy) = 1/107 (106 – 1) + (1 – 1/107) (-1) ≈ -0.9
- E(don’t buy) = 1 (0) = 0
- “You can’t lose if you don’t play!”