
Surveys V1E 12 Sept 2016 www.StatLit.org/pdf/2016-Schield-SLDM-Surveys-Slides.pdf Page 1
2016 SLDM SurveysV1 1
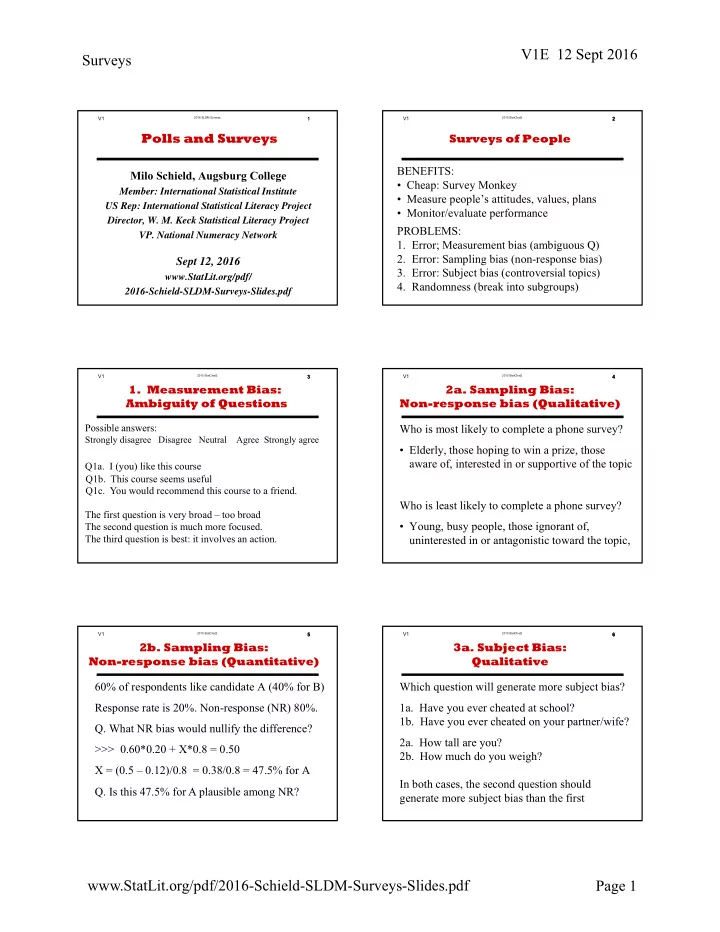
Milo Schield, Augsburg College
Member: International Statistical Institute US Rep: International Statistical Literacy Project Director, W. M. Keck Statistical Literacy Project
- VP. National Numeracy Network
Sept 12, 2016
www.StatLit.org/pdf/ 2016-Schield-SLDM-Surveys-Slides.pdf
Polls and Surveys
V1
2015 StatChat22
Surveys of People BENEFITS:
- Cheap: Survey Monkey
- Measure people’s attitudes, values, plans
- Monitor/evaluate performance
PROBLEMS:
- 1. Error; Measurement bias (ambiguous Q)
- 2. Error: Sampling bias (non-response bias)
- 3. Error: Subject bias (controversial topics)
- 4. Randomness (break into subgroups)
2 V1
2015 StatChat23
- 1. Measurement Bias:
Ambiguity of Questions
Possible answers:
Strongly disagree Disagree Neutral Agree Strongly agree
- Q1a. I (you) like this course
3
- Q1b. This course seems useful
- Q1c. You would recommend this course to a friend.
The first question is very broad – too broad The second question is much more focused. The third question is best: it involves an action.
V1
2015 StatChat24
- 2a. Sampling Bias:
Non-response bias (Qualitative) Who is most likely to complete a phone survey?
- Elderly, those hoping to win a prize, those
aware of, interested in or supportive of the topic Who is least likely to complete a phone survey?
- Young, busy people, those ignorant of,
uninterested in or antagonistic toward the topic,
4 V1
2015 StatChat25
- 2b. Sampling Bias:
Non-response bias (Quantitative) 60% of respondents like candidate A (40% for B) Response rate is 20%. Non-response (NR) 80%.
- Q. What NR bias would nullify the difference?
>>> 0.60*0.20 + X*0.8 = 0.50 X = (0.5 – 0.12)/0.8 = 0.38/0.8 = 47.5% for A
5
- Q. Is this 47.5% for A plausible among NR?
V1
2015 StatChat26
- 3a. Subject Bias:
Qualitative Which question will generate more subject bias?
- 1a. Have you ever cheated at school?
- 1b. Have you ever cheated on your partner/wife?
- 2a. How tall are you?
- 2b. How much do you weigh?
In both cases, the second question should generate more subject bias than the first
6