user guide for interactive presentation
play

User Guide for Interactive Presentation Getting Started Flash - PDF document

User Guide for Interactive Presentation Getting Started Flash Player Version 10 is required to view the Interactive Presentation. If required, Flash Player can be download from the following website


  1. User Guide for Interactive Presentation Getting Started  Flash Player Version 10 is required to view the Interactive Presentation. If required, Flash Player can be download from the following website http://get.adobe.com/flashplayer/?promoid=BUIGP  When clicked, the Interactive Presentation will initialize. A progress bar (shown below) will be displayed. Once initialization is completed the Interactive Presentation will come into view.  Certain types of data may be displayed as Tab sheet. Data will be classified by group and displayed on individual Tab sheet. For example data on BOP, Export and Import will be displayed on 3 Tab sheets (shown below). Using the Controls 
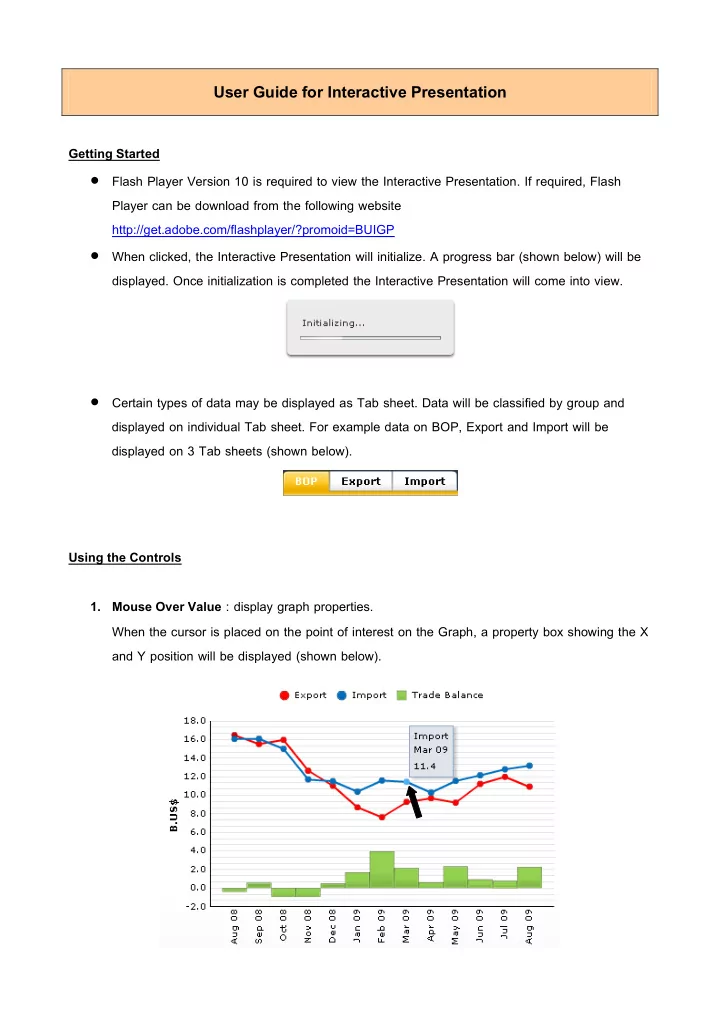
1. Mouse Over Value : display graph properties. When the cursor is placed on the point of interest on the Graph, a property box showing the X and Y position will be displayed (shown below).

  2. From the diagram above, when the cursor move pass the blue point (pointed by the arrow) the details of that particular point will be displayed, ie. the value of import at March 09 totaled 11.4 B.US$. 2. Slider Bar : control the time range on display. Dragging the left slider will set the starting point for the data on display, dragging the right slider will set the end date. Using the left and right sliders will set the time range for data on display. 3. Spinner : control the time range on display. Click the arrows (up/down) to select the data period. The left Spinner will set the starting point for the data on display. The right Spinner will set the end date. Example : use of Slide Bar and Spinner for Manufacturing Production Index (MPI). Data on display from Jun-08 to Sep-09.

  3. To increase the time range on display to Jan-08 to Sep-09, move the left slider or click the left spinner until the beginning period reach Jan-08. 4. Table : display data table accompanying the Graph. The data table will display the latest period available and historical data. The number of historical data on display will depend on the design of the Graph. Data in the Table will change in line with the movement of the right slider on the Slider Bar or the right Spinner.

  4. 5. List Box : control the data on display. Depending on the design of the Graph, List box can be used to select the data to be displayed. In the diagram below, selection of a specific sector will display the data for that sector. Case where Production sector is selected Case where Construction sector is selected

  5. 6. Radio Button : display control similar to the Switch Mode, that is, display specific data set as at a selected period. Example (shown below): data displayed in the table corresponds to the selected radio button. Case where MPI is selected Case where <30% is selected 7. Check Box : control the data on display. Display data according to the selection made. Selection of a data series would display the corresponding graph. Both single and multiple selections are allowed. For series comparison, multiple data series can be selected.

Download Presentation
Download Policy: The content available on the website is offered to you 'AS IS' for your personal information and use only. It cannot be commercialized, licensed, or distributed on other websites without prior consent from the author. To download a presentation, simply click this link. If you encounter any difficulties during the download process, it's possible that the publisher has removed the file from their server.

Recommend


More recommend