
SLIDE 1
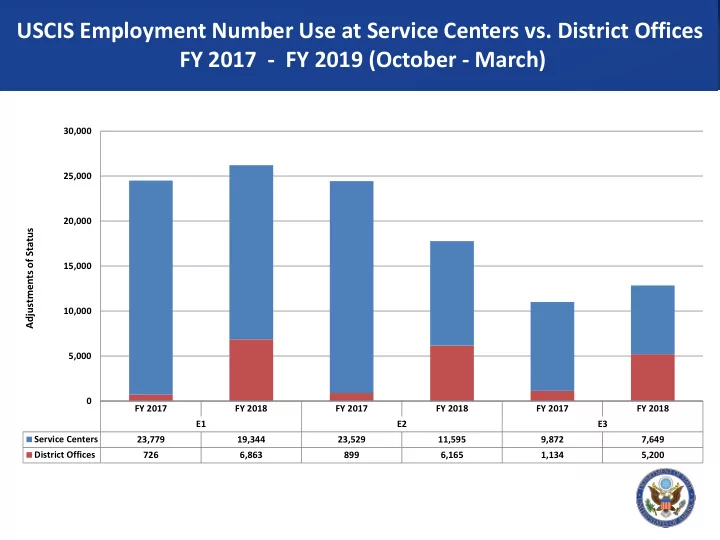
USCIS Employment Number Use at Service Centers vs. District Offices FY 2017 - FY 2019 (October - March)
FY 2017 FY 2018 FY 2017 FY 2018 FY 2017 FY 2018 E1 E2 E3 Service Centers 23,779 19,344 23,529 11,595 9,872 7,649 District Offices 726 6,863 899 6,165 1,134 5,200 5,000 10,000 15,000 20,000 25,000 30,000
Adjustments of Status