Urban Stormwater Research at Colorado School of Mines: Observations - - PowerPoint PPT Presentation

urban stormwater research at colorado school of mines
SMART_READER_LITE
LIVE PREVIEW

Urban Stormwater Research at Colorado School of Mines: Observations - - PowerPoint PPT Presentation

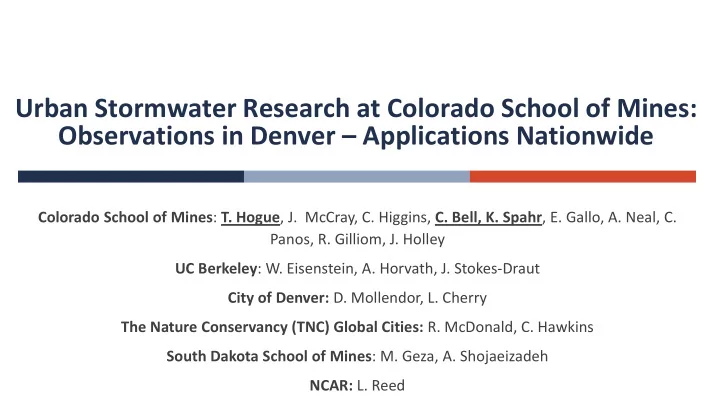
Urban Stormwater Research at Colorado School of Mines: Observations in Denver Applications Nationwide Colorado School of Mines : T. Hogue , J. McCray, C. Higgins, C. Bell, K. Spahr , E. Gallo, A. Neal, C. Panos, R. Gilliom, J. Holley UC


slide-1
SLIDE 1

Urban Stormwater Research at Colorado School of Mines: Observations in Denver – Applications Nationwide

Colorado School of Mines: T. Hogue, J. McCray, C. Higgins, C. Bell, K. Spahr, E. Gallo, A. Neal, C. Panos, R. Gilliom, J. Holley UC Berkeley: W. Eisenstein, A. Horvath, J. Stokes-Draut City of Denver: D. Mollendor, L. Cherry The Nature Conservancy (TNC) Global Cities: R. McDonald, C. Hawkins South Dakota School of Mines: M. Geza, A. Shojaeizadeh NCAR: L. Reed

slide-2
SLIDE 2

Overview of Regional Projects

 Stormwater capture and treatment in

Denver’s Berkeley neighborhood

 Impacts of Denver infill development on city

greenness

 Integrated decision support tool for

grey/green/hybrid stormwater infrastructure

slide-3
SLIDE 3

Denver’s Berkeley Neighborhood

Build Land Cover Development Models Utilize Models to Evaluate Stormwater Change Design Treatment Systems to Capture and Re-use Water

Collaborative project between ReNUWIt/CSM and City and County of Denver

 Feasibility study to model and implement green infrastructure to treat

increased stormwater due to infill in Denver Neighborhoods

slide-4
SLIDE 4

Example of Infill Development

slide-5
SLIDE 5

Example of Infill Development

slide-6
SLIDE 6

Simulating Impacts on Hydrology

Land use change SWMM hydrologic model Impacts on stream flow, water quality

slide-7
SLIDE 7

Use Projections to Design BMP

 Use simulated hydrology post infill to design size of treatment train  Use observed water quality to design biofilter media

Proposed Treatment Train Location Filter Media Schematic

slide-8
SLIDE 8

Vegetation Change in Denver

 Denver was fastest growing city in

America in 2015

 Minimum 0.3% Annual Increase in

Infill Development by 2035

 Importance of Greenness:

 Importance control of urban heat

island effect

 Implications for air temperatures and

  • utdoor water use
slide-9
SLIDE 9

i-DST: Decision Support Tool for Stormwater Infrastructure

 EPA RFP: “National Priorities: Life Cycle

Costs of Water Infrastructure Alternatives”

 Response: Develop an integrated,

scalable, decision support tool (i-DST) for grey, green, and hybrid infrastructure PLANNING

 Components:

life-cycle cost assessment (LCCA) with traditional costs/benefits AND co-benefits of ecosystems

Hydrologic modules

Siting utility

Optimization

Uncertainty assessment

Six Hydrologic Modules:

Green Infrastructure Siting Climate Change

Life-cycle Cost Assessment: Additional Utilities:

Optimization and Uncertainty Assessment

  • Install
  • Operation
  • Maintenance
  • Fees

Social costs + benefits Runoff + Pollutant Loading Grey Infrastructure Conveyance

i-DST

slide-10
SLIDE 10

 Runoff and pollutant loading. Conveyance through

drainage network.

 We will provide simple, sub-hourly model. But users can

also output from any hydrologic model as long as time series are formatted

 We will provide utility for that

 Grey + green infrastructure changing water balance

and pollutant loading

 Climate change projections

 SWMM CAT scalars

Hydrologic Modules

Six Hydrologic Modules:

Green Infrastructure Siting Climate Change Runoff + Pollutant Loading Grey Infrastructure Conveyance

slide-11
SLIDE 11

 Objective: Fully understand the life-cycle decisions by

quantifying direct and indirect costs and benefits:

 Economic

 Life-cycle costs (construction, operation,

maintenance, end of life).

 Environmental benefits

 Flood control / TMDL compliance

 Social

 Green infrastructure may create livability benefits  Increased property values, biodiversity, public health

 Institutional barriers

 The core will be the UC Berkeley WEST tool for life

cycle assessment

Life-Cycle Cost Assessment (LCCA)

Life-cycle Cost Assessment:

  • Install
  • Operation
  • Maintenance
  • Fees

Social costs + benefits

slide-12
SLIDE 12

 Optimization

 Ensure design meets regulations, and user-defined

constraints

 Minimize both direct and holistic life cycle costs

 Uncertainty assessment

 Provide a range of possible performance  Especially valuable as there is intrinsic uncertainty due to

climate change projections and GI performance

Other Utilities

Additional Utilities:

  • Optimization
  • Uncertainty

Assessment

Cost Performance

slide-13
SLIDE 13

 Tool will be developed at a individual site scale:

i-DST-SB

 “SB” = Site or Business scale  Excel platform for ease of use  Will include runoff + pollutant load module, as well

as reductions from GI

 Also, full model will harness more advanced

runoff model for applicability at sewershed scale

 Model will use region-specific data on loading,

GI performance, cost, materials and climate change so it can be used across the U.S.

i-DST: Scalable and region-specific

Site Scale Sewershed Regional Application

slide-14
SLIDE 14
  • Denver, CO
  • Los Angeles, CA
  • Washington D.C.
  • Morgantown, WV
  • Golden, CO
  • New York City, NY

Potential Study Sites

  • Denver, CO
  • Los Angeles, CA
  • Washington, DC
  • Seattle, WA
  • Others?
slide-15
SLIDE 15

Example i-DST Output (Co-Benefit Analysis)

Economic Environmental Institutional Social

Hybrid Infrastructure Option

Template from: http://www.circlesofsustainability.org/circles-overview/profile-circles/

Economic Quadrant for Hybrid Alternative Value Units Ranking … Preferred Value Color Life Cycle Costs 10 M $ 5 Low Operation and Maintenance 10 k $ / yr 5 Low Capital Costs 2 M $ PV 3 Low …

(a) Assign Color Based on User Input (b) Graphically Display MCA Results

Environmental Quadrant for Hybrid Alternative Value Units Ranking … Preferred Value Color Peak Flow Attenuation 15 cfs 5 High Pollutant Load Reduction 80 % 4 High Green Space Created .5 acres 1 High …

Color Scale

Higher Preference Option

slide-16
SLIDE 16

Co-Benefit Analysis Workflow Process

Science Advisory Board Helps Rank Decision Factors Regionalize Defaults Using Ranking and Physical Data Validate and Expand Analysis Using Case Studies

Denver Metro Area

slide-17
SLIDE 17

Questions?

Contact: idst@mines.edu Follow us: @iDST_Team i-dst.mines.edu