SLIDE 1
HCDAG Meeting May 2, 2018
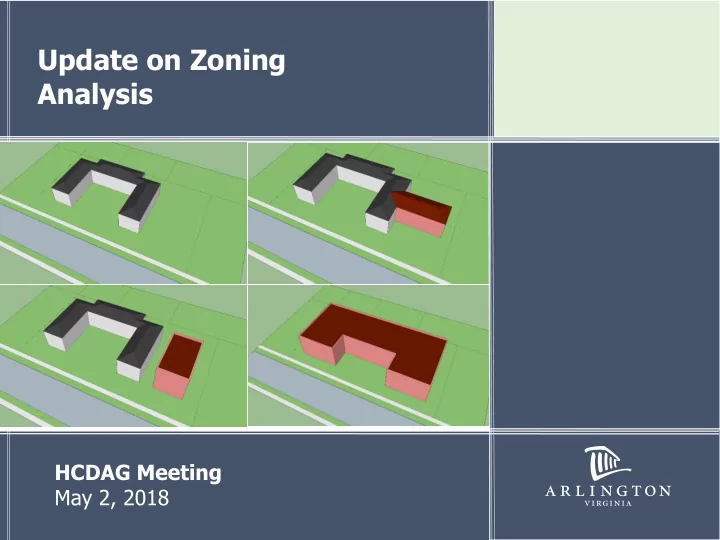
Update on Zoning Analysis
SLIDE 2 Poverty Rates by Census Tracts
2
Presentation Overview
- Approach to HCD Area Analysis
- Considerations for Building Placement
- Considerations for Building Height
SLIDE 3 Poverty Rates by Census Tracts
3
Context of Zoning Incentives
- Financial Incentives
- Zoning Incentives
- Properties can still develop per by-right standards
- Offer new development options for HCD property owners
- Provisions need to be flexible enough to work in a variety
- f contexts
SLIDE 4 Poverty Rates by Census Tracts
4
Approach to Analyzing HCD Areas
- Existing Conditions
- Character of Area
- Historic Resource Inventory
- Street Network/Block Pattern
- Roadway Classification and Conditions
- Proximity to Transit
- Existing Open Spaces and Tree Canopy
- Lot Analysis
- Building Analysis
- Development Analysis (Future Meeting)
SLIDE 5 Poverty Rates by Census Tracts
5
Penrose Area Analysis
Essential Important Important Top 1/3 Notable
2 2 3 3 3 4 4 5 5 6 7 7 6 Historic Resources Inventory Sites: N
2nd St. S.
- S. Veitch St.
- S. Wayne St.
1 6 1
SLIDE 6 Poverty Rates by Census Tracts
6
Penrose Area Analysis
Street Network/ Block Pattern:
2nd St. S.
- S. Veitch St.
- S. Wayne St.
400’
N
SLIDE 7 Poverty Rates by Census Tracts
7
Penrose Area Analysis
Limited Access Route Arterial Type D:
Primarily garden Apartments and Townhouse Neighborhoods
Arterial Type E:
Primarily Single Family Residential Neighborhoods
Residential Local Street
Roadway Classification (Street Typology):
2nd St. S.
- S. Veitch St.
- S. Wayne St.
6th St. S.
N
SLIDE 8 Poverty Rates by Census Tracts
8
Penrose Area Analysis
Arterial Type D
South Courthouse Road 2nd Street South
Arterial Type E
Complete Street Elements:
- Transit Service: Moderate
- Bike Accommodations: Desired
- On-Street Parking Priority: High
- Pedestrian Way (sidewalk and green
strips): Desired Complete Street Elements:
- Transit Service: Limited
- Bike Accommodations: Desired
- On-Street Parking Priority: Medium
- Pedestrian Way (sidewalk and green
strips): Desired
SLIDE 9 Poverty Rates by Census Tracts
9
Penrose Area Analysis
Residential Local Streets
6th Street South South Veitch Street South Wayne Street
Complete Street Elements:
- Transit Service: Limited-None
- Bike Accommodations: Desired
- On-Street Parking Priority: High
- Pedestrian Way (sidewalk and green strips):
Desired
SLIDE 10 Poverty Rates by Census Tracts
10 10
Penrose Area Analysis
ART Metro Bus
Transit Routes:
2nd St. S.
- S. Veitch St.
- S. Wayne St.
N
SLIDE 11 Poverty Rates by Census Tracts
11 11
Penrose Area Analysis
Existing Open Spaces and Tree Canopy
2nd St. S.
- S. Veitch St.
- S. Wayne St.
Penrose Park
N
SLIDE 12 Poverty Rates by Census Tracts
12 12
Penrose Area Analysis
Garden Apartments Duplex Semi-detached Townhouse Single Family
A Lot/Building Types: A B B B C H E F C D D B E 2 1 A A B 3
2nd St. S.
- S. Veitch St.
- S. Wayne St.
6th St. S.
N
SLIDE 13 Poverty Rates by Census Tracts
13 13
Penrose Area Analysis
E B A D C F G H
5 units 2 Stories 80’ – 95’ x 70’ - 80’ lot 7,500 sf – 7,620 sf lot 11 units 2 Stories + Basement 100’ + lot 12,600 sf + lot 8 units 2 Stories 50’ x 110’ Lot/ Irregular Lot 5,500 sf lot/ 9,666 sf lot 9 units 3 Stories 100’ x 110’ lot 11,000 sf lot 14 units 4 Stories Irregular lot 20,410 sf lot 30 units (2 Buildings) 3 Stories Irregular lot 42,795 sf lot 16 units 3 -4 Stories Irregular lot 28,200 sf lot 74 units 3-4 Stories Irregular lot 111,500 sf lot
Garden Apartments
SLIDE 14 Poverty Rates by Census Tracts
Penrose Area Analysis
B A C
1 unit 2 Stories 25’ x 110’ lot 2,750 sf lot
Semi-detached
1 unit 2 Stories 25’ x 70’ - 145’ lot Irregular lot (2,142 sf +) 1 unit 2 Stories 25’ x 100’ lot 2,500 sf lot
Often Nonconforming for:
- Setbacks
- Lot width and depth
- Lot Coverage
- Lot Area
SLIDE 15
Poverty Rates by Census Tracts CONSIDERATIONS FOR BUILDING PLACEMENT AND HEIGHT
SLIDE 16 Poverty Rates by Census Tracts
Outline of Proposed Zoning Incentives
- KEEP EXISTING BUILDINGS WHILE ADDING NEW UNITS WITHIN
EXISTING WALLS
- KEEP EXISTING BUILDINGS WHILE CONSTRUCTING NEW
RESIDENTIAL BUILDINGS ELSEWHERE ON THE PROPERTY
- KEEP A SHARE OF EXISTING BUILDINGS WHILE REPLACING SOME
WITH NEW RESIDENTIAL BUILDINGS
- REMOVE ALL EXISTING BUILDINGS AND UTILIZE MORE FLEXIBLE
ZONING STANDARDS TO REPLACE THEM WITH NEW RESIDENTIAL BUILDINGS
- KEEP EXISTING BUILDINGS WHILE EXPANDING THEM TO ADD
NEW LIVING SPACE OR DWELLING UNITS POTENTIAL NEW OPTIONS FOR MULTIPLE-FAMILY PROPERTY OWNERS:
SLIDE 17 Poverty Rates by Census Tracts
Implications
- Allowing for physical changes to existing properties
- Consider where these changes might occur on a lot
- Which locations are most feasible?
- Where changes are feasible, are they contextually
appropriate?
- If changes are feasible and appropriate, which specific
zoning changes are required?
- Setbacks
- Lot Coverage
- Height
SLIDE 18 Poverty Rates by Census Tracts
Considerations for HCD Areas
arterial roadways
- Blend apartment living with
more privacy and open space
vision is for low-medium to medium-scale development
SLIDE 19 Poverty Rates by Census Tracts
HCD Objectives
- Preserve market-rate affordable housing up to 80% of AMI
- Provide committed affordable (CAF) rental housing up to
60% and 80% of AMI
- Provide ownership housing between 80% and 120% AMI
- Preserve buildings listed on the Historic Resources Inventory
(HRI) or National Register
- Incorporate sustainable building practices
- Encourage renovation and infill development while
accommodating redevelopment
- Ensure projects are compatible with their surroundings
- Ensure any new density can be supported by existing
infrastructure, including the transit network
- Encourage the creation of underrepresented housing forms
SLIDE 20 Poverty Rates by Census Tracts
Considerations for HCD Areas
Where physical changes occur:
- Implement Comprehensive Plan goals and objectives
- e.g. enhance walkability where new development occurs
- Add or preserve landscaping along the street
- Create “eyes on the street” for pedestrians
- Continue to support low-medium to medium-scale development
- Retain a mix of housing options for Arlington residents
- Corridors provide for higher-density, “urban village” lifestyles
- Single-family neighborhoods are often beyond reach
- HCD areas provide a middle ground of more affordable apartment
housing mixed with more privacy and open space
- Appeal to residents at various stages of the life cycle
- Respectfully blend new development into existing neighborhoods
SLIDE 21 Poverty Rates by Census Tracts
Additions to Existing Buildings
KEEP EXISTING BUILDINGS WHILE EXPANDING THEM TO ADD NEW LIVING SPACE OR DWELLING UNITS
- More commonly pursued by affordable housing nonprofits
CONSIDERATIONS:
- Structural work can be expensive
- Historically-significant building façades
- Surrounding properties
SLIDE 22 Poverty Rates by Census Tracts
Considerations for Bump-Outs/Additions
Additions should generally
- ccur toward the rear of the
building / property.
established character along the streetscape
façades (where applicable)
SLIDE 23 Poverty Rates by Census Tracts
Considerations for Bump-Outs/Additions
Appropriate locations for additions to historic buildings may vary. Additions should generally
the building / property.
- Some properties oriented “outward”
toward the streetscape
- Other properties oriented “internally”
toward lawns and courtyards
SLIDE 24 Poverty Rates by Census Tracts
Questions on Bump- Outs/Additions
For properties not considered historic, would additions to side façades be appropriate?
SOUTH COURTHOUSE ROAD SAMPLE
SLIDE 25 Poverty Rates by Census Tracts
Questions on Bump- Outs/Additions
Should side additions be
- riented closer to the street
- r should they be set back
further from the street?
SOUTH COURTHOUSE ROAD SAMPLE
SLIDE 26 Poverty Rates by Census Tracts
Infill on Existing Properties
KEEP EXISTING BUILDINGS WHILE CONSTRUCTING NEW RESIDENTIAL BUILDINGS ELSEWHERE ON THE PROPERTY CONSIDERATIONS:
- New construction, with related cost efficiencies
- Design and layout of historically-significant buildings and open
spaces
SLIDE 27
Poverty Rates by Census Tracts
Considerations for Infill Development
More flexibility to accommodate infill development on larger lots
SLIDE 28
Poverty Rates by Census Tracts
Considerations for Infill Development
Less flexibility to accommodate infill development on smaller lots
SLIDE 29
Poverty Rates by Census Tracts
Considerations for Infill Development
Scale of potential infill development varies according to the size of the lot. Would require more flexible setback standards.
SLIDE 30 Poverty Rates by Census Tracts
Questions on Infill Development
Situate infill buildings closer to the public right-
SLIDE 31 Poverty Rates by Census Tracts
Questions on Infill Development
Situate infill buildings closer to the public right-
SLIDE 32
Poverty Rates by Census Tracts
Questions on Infill Development
“Tuck” infill development away from the public right-of-way?
SLIDE 33
Poverty Rates by Census Tracts
Questions on Infill Development
“Tuck” infill development away from the public right-of-way?
SLIDE 34 Poverty Rates by Census Tracts
Considerations for Infill Development
Site infill development so as to preserve, enhance, or replicate the existing layout.
- Infill may not be appropriate in the
center of a purposefully-designed courtyard or open space
- Infill may be more appropriate where
it can frame an existing courtyard or
SLIDE 35
Poverty Rates by Census Tracts
Considerations for Infill Development
Where feasible, site infill buildings along existing public rights-of-way? Attempt to consolidate parking.
SLIDE 36 Poverty Rates by Census Tracts
Partial Redevelopment
KEEP A SHARE OF EXISTING BUILDINGS WHILE REPLACING SOME WITH NEW RESIDENTIAL BUILDINGS CONSIDERATIONS:
- Existing buildings and dwelling units
- May be historically-significant
- New construction, with related cost efficiencies
- Surrounding properties
SLIDE 37 Poverty Rates by Census Tracts
Considerations for Partial Redevelopment
A share of existing buildings and open space areas should be preserved. Site new development so as to preserve, enhance, or replicate the existing development pattern on the site.
EXISTING CONCEPTUAL
MIMIC COURTYARD
SLIDE 38 Poverty Rates by Census Tracts
Full Redevelopment
REMOVE ALL EXISTING BUILDINGS AND UTILIZE MORE FLEXIBLE ZONING STANDARDS TO REPLACE THEM WITH NEW RESIDENTIAL BUILDINGS CONSIDERATIONS:
- Existing buildings and dwelling units
- New construction, with related cost efficiencies
- Surrounding properties
SLIDE 39 Poverty Rates by Census Tracts
Considerations for Full Redevelopment
Design and orient new buildings to provide each dwelling unit with sufficient light, air circulation, and views of open space. Encourage designs that replicate the earlier layout of the site.
CONCEPTUAL
SLIDE 40 Poverty Rates by Census Tracts
Height Considerations for Infill and Redevelopment in the HCD
WHAT WE’VE HEARD:
- Consider alternative height toward the center of
larger lots
- Consider alternative height along major roadways
- Taper additional height away from single-family
neighborhoods
SLIDE 41 Poverty Rates by Census Tracts
Existing Height Provisions
ZONING DISTRICT MAXIMUM HEIGHT BY-RIGHT MAXIMUM HEIGHT BY SITE PLAN RA14-26
LOTS <5 ACRES
35 feet (3.5 stories)
LOTS ≥ 5 ACRES
60 feet (6 stories)* N/A RA8-18 40 feet (4 stories) 75 feet (8 stories)
LOTS ≥ 20 ACRES
95 feet (10 stories)
FORT MYER HEIGHTS NORTH “REVITALIZATION AREA”:
125 feet (12 stories) RA6-15 60 feet (6 stories) 125 FEET (12 STORIES)
*And where buildings are at least 150 feet from the nearest boundary line.
SLIDE 42 Poverty Rates by Census Tracts
Existing Provision for Height on Larger Lots
- Zoning Ordinance offers a height exception for lots zoned
RA14-26 that are a minimum 5 acres in size (§6.2.3.D)
Property Line Property Line 3.5 STORIES 35 FEET MAXIMUM 6 STORIES 60 FEET MAXIMUM 150 FEET MINIMUM 150 FEET MINIMUM 3.5 STORIES 35 FEET MAXIMUM
SLIDE 43 Poverty Rates by Census Tracts
Alternative Height on Larger Lots
- Consider using RA14-26 provision as a guide
- Through modeling, identify potential setback or transition
points where alternative building height might be appropriate (future meeting)
3 STORIES 3 STORIES 4 STORIES 4 STORIES 5 STORIES DISTANCE “X” DISTANCE “X” DISTANCE “Y” DISTANCE “Y”
SLIDE 44
Poverty Rates by Census Tracts
Alternative Height Along Roadways
MASTER TRANSPORTATION PLAN MAP
SLIDE 45 Poverty Rates by Census Tracts
Alternative Height Along Roadways
Consider alternative building height when abutting:
- An Arterial-Street
- Lee Highway
- Old Dominion
- Washington Boulevard
- Arlington Boulevard
- A Limited-Access Route
- Portions of VA-27/Washington Boulevard
- A High-Occupancy Incentive Corridor
- I-395
- I-66
SLIDE 46 Poverty Rates by Census Tracts
Alternative Height Along Roadways
2ND STREET SOUTH
SLIDE 47 Poverty Rates by Census Tracts
Alternative Height Along Roadways
S-3A PUBLIC ZONING DISTRICT
ROADWAY CONDITION
- Courthouse Road
- 2nd Street South
- VA-27 / South
Washington Boulevard
SLIDE 48 Poverty Rates by Census Tracts
Height Considerations for Infill and Redevelopment in the HCD
ADDITIONAL CONTEXTS WHERE ALTERNATIVE HEIGHT MIGHT BE CONSIDERED:
Where abutting:
- A higher-intensity residential zoning district
- RA14-26 to RA6-15
- 35 feet vs. 60 feet
- RA8-18 to RA6-15
- 40 feet vs. 60 feet
- A public zoning district
- A commercial zoning district
Where across the street from one of these contexts
SLIDE 49 Poverty Rates by Census Tracts
Height Considerations for Infill and Redevelopment in the HCD
ACROSS THE STREET FROM A C-2 COMMERCIAL ZONE?
RA8-18 40 feet height C-2 45 feet height
SLIDE 50 Poverty Rates by Census Tracts
Height Considerations for Infill and Redevelopment in the HCD
ACROSS THE STREET FROM AN S-3A PUBLIC ZONING DISTRICT?
RA8-18 40 feet height S-3A 45 feet height
SLIDE 51 Poverty Rates by Census Tracts
Alternative Height Considerations
ZONING DISTRICT MAXIMUM HEIGHT BY-RIGHT HCD INCENTIVE HEIGHT MAXIMUM HEIGHT BY SITE PLAN RA14-26
LOTS <5 ACRES
35 feet (3.5 stories)
LOTS ≥ 5 ACRES
60 feet (6 stories)* TBD N/A RA8-18 40 feet (4 stories) TBD 75 feet (8 stories)
LOTS ≥ 20 ACRES
95 feet (10 stories)
FORT MYER HEIGHTS NORTH “REVITALIZATION AREA”:
125 feet (12 stories) RA6-15 60 feet (6 stories) TBD 125 FEET (12 STORIES)
*And where buildings are at least 150 feet from the nearest boundary line. Site Plan
MIDDLE GROUND
By-Right