
SLIDE 1
Update on the Copper BLM vs. MLR performance
(Biotic Ligand Model vs. Multiple Linear Regression model)
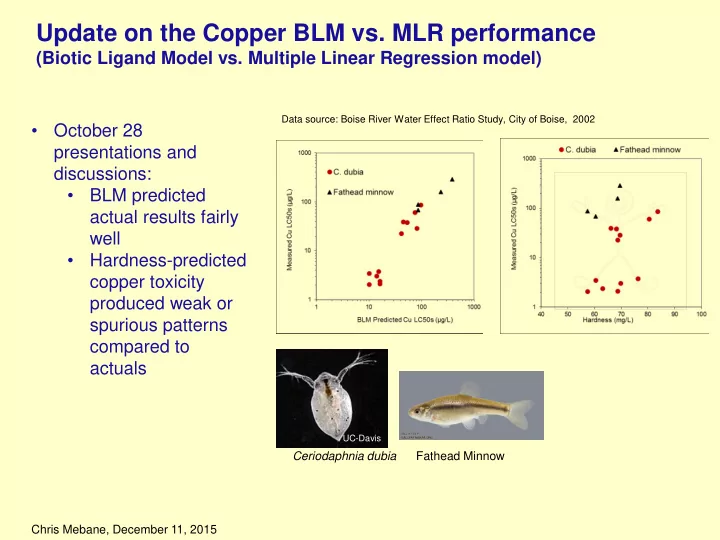
Data source: Boise River Water Effect Ratio Study, City of Boise, 2002
UC-Davis
- October 28
presentations and discussions:
- BLM predicted
actual results fairly well
- Hardness-predicted
copper toxicity produced weak or spurious patterns compared to actuals
Ceriodaphnia dubia Fathead Minnow Chris Mebane, December 11, 2015