Union KBC TRIGGER FUND - SERIES 2 A Close-ended Equity Scheme In - - PowerPoint PPT Presentation

union kbc
SMART_READER_LITE
LIVE PREVIEW

Union KBC TRIGGER FUND - SERIES 2 A Close-ended Equity Scheme In - - PowerPoint PPT Presentation

Union KBC TRIGGER FUND - SERIES 2 A Close-ended Equity Scheme In case the predetermined growth is not achieved during the 3 year period, the scheme would mature at the end of 3 years at the then prevailing NAV. Automatically redeems your


slide-1
SLIDE 1

A Close-ended Equity Scheme

TRIGGER FUND - SERIES 2

Union KBC

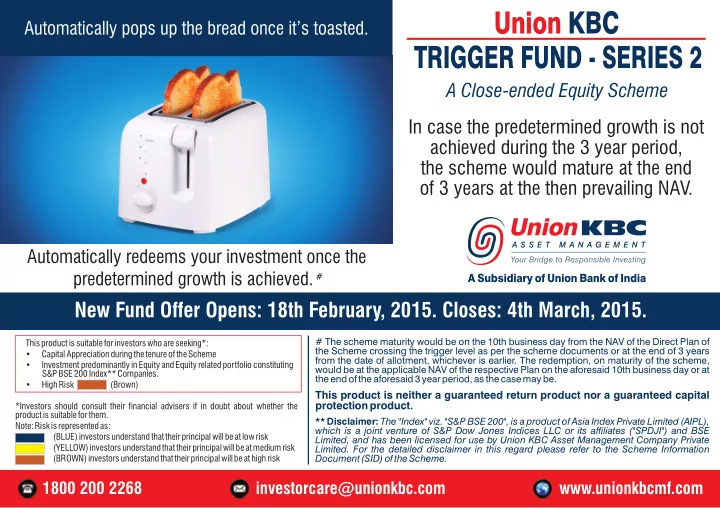
Automatically redeems your investment once the

#

predetermined growth is achieved.

In case the predetermined growth is not achieved during the 3 year period, the scheme would mature at the end

  • f 3 years at the then prevailing NAV.

# The scheme maturity would be on the 10th business day from the NAV of the Direct Plan of the Scheme crossing the trigger level as per the scheme documents or at the end of 3 years from the date of allotment, whichever is earlier. The redemption, on maturity of the scheme, would be at the applicable NAV of the respective Plan on the aforesaid 10th business day or at the end of the aforesaid 3 year period, as the case may be.

This product is neither a guaranteed return product nor a guaranteed capital protection product.

** Disclaimer: The "Index" viz. "S&P BSE 200", is a product of Asia Index Private Limited (AIPL), which is a joint venture of S&P Dow Jones Indices LLC or its affiliates ("SPDJI") and BSE Limited, and has been licensed for use by Union KBC Asset Management Company Private

  • Limited. For the detailed disclaimer in this regard please refer to the Scheme Information

Document (SID) of the Scheme. This product is suitable for investors who are seeking*:

  • Capital Appreciation during the tenure of the Scheme
  • Investment predominantly in Equity and Equity related portfolio constituting

S&P BSE 200 Index** Companies.

  • High Risk

(Brown) *Investors should consult their financial advisers if in doubt about whether the product is suitable for them. Note: Risk is represented as: (BLUE) investors understand that their principal will be at low risk (YELLOW) investors understand that their principal will be at medium risk (BROWN) investors understand that their principal will be at high risk

New Fund Offer Opens: 18th February, 2015. Closes: 4th March, 2015.

investorcare@unionkbc.com 1800 200 2268 www.unionkbcmf.com

slide-2
SLIDE 2

Turnaround of India story during Calendar Year (CY) 2014 - A Snapshot

2

slide-3
SLIDE 3

Events during CY 2014 that helped in positive market sentiments

3

✔ single political party forming the Central Government ✔ The new Central Government announced an elongated list of policy measures and reforms to enhance the economic growth, such as:

  • Emphasis on infrastructure development to reduce

bottlenecks faced by the Industries.

  • Reducing and simplifying the process for doing business in

India.

  • ‘Make in India’, an initiative to develop India as a global

manufacturing base.

  • Opening of key sectors for public investment, both,

domestic as well as foreign.

  • ‘Pradhan Mantri Jan Dhan yojana’, an initiative to bring the

whole country under the banking net. Historical outcome of General Elections 2014; after 30 years, a

‘Make in India’ initiative Parliament in session

slide-4
SLIDE 4

Global commodity prices from January 2014 – January 2015

4

Major global commodity prices declined on the back of lower global demand. Approximately 75% of India's crude oil requirements are met through imports. The crude

  • il price at the current level, helps India in multiple

ways, such as ✔ Reduction in Current Account Deficit (CAD). ✔ Lower Inflation Level. ✔ To conserve Foreign Exchange.

Data Source: Bloomberg

Jan-14 Feb-14 Mar-14 Apr-14 May-14 June-14 Jul-14 Aug-14 Sep-14 Oct-14 Nov-14 Dec-14 Jan-15 Brent Crude Gold Silver 40 50 60 70 80 90 100 110 120

slide-5
SLIDE 5

S&P BSE 200 Index** movement from January 2014 till January 2015.

5 Equity market rally during CY 2014 can be broken into two periods: ✔ Period till May 16, 2014 – Markets rallied on the back of Pre General Election expectation. ✔ Period post May 16, 2014 – Markets rallied on the back of historical election results that boosted positive sentiments, further supported by favorable commodity prices and enhanced confidence of both Foreign as well as domestic investors. Data Source: Bloomberg

2300 2500 2700 2900 3100 3300 3500 3700 Jan-14 Feb-14 Mar-14 Apr-14 May-14 Jun-14 Jul-14 Aug-14 Sep-14 Oct-14 Nov-14 Dec-14 Jan-15 Start and end of General Election 2014 process

Pre General Election Period Post General Election Period Decline in Crude Oil Prices

Post election rally led by ‘feel good’ factor Post election rally primarily led by fall in crude price

** Note: For the detailed Benchmark disclaimer please refer the last page.

slide-6
SLIDE 6

CY 2014 was a strong year for the Equity Markets. Will it continue further?

6

slide-7
SLIDE 7

Factors that may keep the BALL ROLLING……..

7

✔ ✔ Lower interest rate may further boost Credit Growth. ✔ Credit Growth may prompt business expansion. ✔ Business expansion may help in improving Earnings Per Share (EPS). ✔ EPS growth may lead to Price Earning (P/E) ratio re-rating. The above sequence is well connected and may help the market scale up further, fundamentally. Lower inflation may kick start interest rate cut cycle.

Inflation Interest Rate Credit Growth

EPS Growth

P/E Valuation

slide-8
SLIDE 8

Are there reasons to believe that the party is not over yet?

8

slide-9
SLIDE 9

Improving factors that could support the market further…….

9

Much needed reduction in inflation level due to: ✓ soft food article prices ✓ lower crude oil prices ✓ higher base effect Lower Inflation level has set the stage for lower interest rate regime.

Data Source: Bloomberg, Reserve Bank of India

Inflation level reaching under Reserve Bank of India’s (RBI) target level, created the headroom for reducing the Interest Rate. RBI reduced the benchmark rates by 0.25%

  • n 15th January 2015. RBI maintained status quo on rates

in the monetary policy review meeting held on 3rd February 2015. In CY 2015, RBI may cut rates further to support economic growth and boost credit growth.

Reducing CPI (YoY) inflation level………

4.00% 5.00% 6.00% 7.00% 8.00% 9.00% 10.00% 11.00% 12.00% Jan-12 Jun-12 Nov-12 Apr-13 Sep-13 Feb-14 Jul-14 Dec-14 Bank Rate (Marginal Standing Facility) Repo Reverse Repo 3.00% 4.00% 5.00% 6.00% 7.00% 8.00% 9.00% 10.00% 11.00% Rate cut after a long pause Feb-01 Feb-02 Feb-03 Feb-04 Feb-05 Feb-06 Jan-07 Jan-08 Jan-09 Jan-10 Jan-11 Jan-12 Jan-13 Jan-14 Jan-15

Softer Interest Rates may be a reality going forward……….

slide-10
SLIDE 10

Improving factors that could support the market further……. (continued)

10

Reducing Interest Rate regime could fuel credit offtake, which is at a multi year low. Rise in Credit Growth will lead to higher business expansion which may in turn support rise in Earning Per Share (EPS).

Data Source: Bloomberg, Reserve Bank of India

As the economic trend picks up, EPS growth could be well supported by positive trend in corporate sales leading to higher corporate profit margins. The trend line depicts the moving average of EPS over a long term period. Growth in EPS in CY 2014, higher than the average may be an indicator of improving EPS going forward.

Credit Growth at lowest level………

15% 11% 16% 16% 19% 12% 26% 16% 32% 32% 31% 23% 26% 11% 23% 18% 17% 14% 11% 10% 15% 20% 25% 30% 35% CY 1996 CY 1997 CY 1998 CY 1999 CY 2000 CY 2001 CY 2002 CY 2003 CY 2004 CY 2005 CY 2006 CY 2007 CY 2008 CY 2009 CY 2010 CY 2011 CY 2012 CY 2013 CY 2014

195 253 272 253 231 196 210 231 312 387 505 606 736 780 780 871 942 1109 1181 1462

200 400 600 800 1000 1200 1400 1600 In Rupees CY 1995 CY 1996 CY 1997 CY 1998 CY 1999 CY 2000 CY 2001 CY 2002 CY 2003 CY 2004 CY 2005 CY 2006 CY 2007 CY 2008 CY 2009 CY 2010 CY 2011 CY 2012 CY 2013 CY 2014 Note: EPS of S&P BSE SENSEX Index is used to depict broader market. Trend line depicts the moving average

EPS Growth Trend………

slide-11
SLIDE 11

Improving factors that could support the market further…….. (continued)

11

Historically the P/E ratio of S&P BSE SENSEX Index has touched 32.24x on the higher side. Historical long term average P/E ratio of S&P BSE SENSEX Index has been around 18.11x (18.11 times earnings). Current market P/E ratio at 19.67x, is anyway close to the long term average level and the expected EPS expansion should bring back the P/E level further down to the long term average level; making the market more attractive for further investments.

Data Source: Bloomberg

Current P/E level still closer to the long term average…

Improving macro economic factors are creating a compelling reason for investing in equities now.

19.67 32.34 18.11 7 12 17 22 27 32 Sensex P/E Higheest Sensex P/E Average P/E P/E (X times) Jan-95 Jan-96 Jan-98 Jan-99 Jan-00 Jan-01 Jan-02 Jan-03 Jan-04 Jan-05 Jan-06 Jan-07 Jan-08 Jan-09 Jan-10 Jan-11 Jan-12 Jan-13 Jan-14 Jan-15 Note: P/E ratio of S&P BSE SENSEX Index is used to depict broader market.

slide-12
SLIDE 12

Revisiting the Union KBC Trigger Fund as a Concept…

12

slide-13
SLIDE 13

Typical dilemma an investor faces

13

Often investors are well advised on all aspects related to investing, but very rarely somebody advises them on when to exit and book profit.

Is it a good time to invest? Time horizon? Will I really make money? When to exit? Sir, I have a solution that will answer all your concerns

slide-14
SLIDE 14

Invest with an inbuilt Trigger Mechanism defining the Exit Point

14

Just like the alarm rings at a pre-determined time….. Likewise, the Trigger mechanism automatically redeems your investment once the pre-determined target is achieved. As one needs to be disciplined while investing, it is also important to realize profit in a disciplined manner. The Trigger mechanism works without any emotions attached. Union KBC Trigger Fund – Series 1 was launched on 1st November 2013 and was able to achieve the Trigger level in a little more than 8 months.

slide-15
SLIDE 15

S&P BSE 200 Index** movement: ‘Hit’ for Some and ‘Miss’ for the Rest

15

At the time of launch of Union KBC Trigger Fund - Series 1, there were apprehensions among many, that the Index level is nearing its peak.

Data Source: Bloomberg

The Index entered a bull run and achieved new highs on the back of domestic events.

500 1000 1500 2000 2500 3000 3500 4000

Period from Apr 2009 till Oct 2013

Apr-09 Jun-09 Aug-09 Oct-09 Dec-09 Mar-10 May-10 Jul-10 Sep-10 Dec-10 Feb-11 Apr-11 Jun-11 Sep-11 Nov-11 Jan-12 Mar-12 May-12 Aug-12 Oct-12 Dec-12 Feb-13 May-13 Jul-13 Sep-13 Nov-13 Feb-14 Apr-14 Jun-14 Aug-14 Nov-14 Jan-15 500 1000 1500 2000 2500 3000 3500 4000 Apr-09 Jan-15 Nov-14 Aug-14 Jun-14 Apr-14 Feb-14 Nov-13 Sep-13 Jul-13 May-13 Feb-13 Dec-12 Oct-12 Aug-12 May-12 Mar-12 Jan-12 Nov-11 Sep-11 Jun-11 Apr-11 Feb-11 Dec-10 Sep-10 Jul-10 May-10 Mar-10 Dec-09 Oct-09 Aug-09 Jun-09 Period from Nov 2013 till Jan 2015

** Note: For the detailed Benchmark disclaimer please refer the last page.

slide-16
SLIDE 16

Presenting Union KBC Trigger Fund – Series 2

16

Scheme Objective: The investment objective of the Scheme is to seek to generate capital appreciation by investing in a portfolio of equity and equity related securities, predominantly constituted of Companies in S&P BSE 200 Index**. However, there is no assurance that the investment objective of the Scheme will be realized and the Scheme does not assure or guarantee any returns. Scheme Type: A Close-Ended Equity Scheme Portfolio composition (% of total assets): Equity and equity related instruments constituted of companies in S&P BSE 200 Index** 80% to 100%; Debt, Money Market Instruments, cash and equivalent 0% to 20%. Benchmark: S&P BSE 200 Index**. Unique Feature: In-built Trigger mechanism. Trigger Level: Trigger level will be achieved whenever the NAV of the Direct Plan of the Scheme crosses ` 13 per unit within the 3 year period. In case the trigger level is not achieved during the 3 year period, the scheme would mature at the end of 3 years at the then prevailing NAV. Maturity: 10th Business Day from the NAV of the Direct Plan of the Scheme crossing the trigger level or at the end of 3 years from the Date of Allotment, whichever is earlier. Minimum Investment: ` 5,000 and in multiples of ` 10 thereafter. Plans / Option: Regular and Direct Plan with Growth Option only. ** Note: For the detailed Benchmark Disclaimer, please refer the last slide.

slide-17
SLIDE 17

Two Trigger Scenarios that can prevail

17

Scenario 1: Return Based Trigger level achieved In the event that the NAV of the Direct Plan of the Scheme crosses ` 13/- per unit (trigger level) within a 3 year period from the date of allotment, the Scheme will automatically be liquidated on the 10th business day from the NAV of the Direct Plan crossing ` 13/- and the redemption proceeds at the applicable NAV of the 10th business day will be returned to the investors of both the Plans under the Scheme. Scenario 2: Trigger level not achieved In the event that the NAV of the Direct Plan of the Scheme does not cross ` 13/- per unit (trigger level) at any time during the 3 year period from the date of allotment, the Scheme will mature at the end of 3 years and the redemption proceeds at the applicable NAV of the respective Plans at the time of maturity of the Scheme will be returned to the investors of both the Plans under the Scheme.

3 year close-ended Equity Scheme if trigger not achieved

slide-18
SLIDE 18

✓ If the NAV crosses ` 13 per unit, will I get back exactly the same amount?

  • No. If the NAV of the Direct Plan of the Scheme crosses 13 per unit, the fund manager will initiate liquidation of the portfolio, and the

Scheme would be wound up on the 10th business day from the NAV of the Direct Plan of the Scheme crossing the trigger level. As the market price of securities may move up or down from the date of the NAV of the Direct Plan meeting the trigger level (` 13/-) till the 10th business day as mentioned above, the actual repurchase price that you receive may be below or above the trigger level, depending on the market conditions at that time and the NAV of the respective Plan of the Scheme (Direct or Regular) in which you have invested. If the trigger level is achieved within a period of 1 year, Short Term Capital Gains may be applicable on such proceeds. Investors are requested to go through the illustration provided in the Key Information Memorandum (KIM) and Scheme Information Document (SID) under the section viz. 'Duration/Maturity' to understand this feature clearly.

✓ What if the NAV per unit of the Direct Plan does not touch ` 13 at any time during the three year period?

In that case, the Scheme will mature at the end of 3 years from the date of allotment including the date of allotment and the redemption proceeds would be paid back to the investors of both the Plans at the applicable NAV of the respective Plan at the time

  • f maturity of the scheme.

✓ At the time of subscribing the units during the NFO period, can I opt to switch the redemption proceeds receivable on maturity to another eligible scheme of Union KBC Mutual Fund?

Yes, all investors have an option of switching their redemption proceeds receivable on maturity of the Scheme to another eligible scheme of Union KBC Mutual Fund. Investors can avail of this facility by indicating their intention in the application form at the time of subscribing the units of the Scheme during the NFO period. For more details regarding the facility and the eligible scheme, investors are requested to refer the section on 'Auto Switch of Redemption Proceeds of Union KBC Trigger Fund- Series 2 on Maturity' in the SID and KIM.

✓ Does the scheme guarantee any return or provide any capital protection?

This product is neither a guaranteed return product nor a guaranteed capital protection product. `

Union KBC Trigger Fund – Series 2 – Frequently Asked Questions (FAQs)

18

slide-19
SLIDE 19

** Disclaimer: The "Index" viz. "S&P BSE 200", is a product of Asia Index Private Limited (AIPL), which is a joint venture of S&P Dow Jones Indices LLC or its affiliates ("SPDJI") and BSE Limited, and has been licensed for use by Union KBC Asset Management Company Private

  • Limited. For the detailed disclaimer in this regard please refer to the Scheme Information Document (SID) of the Scheme.

MUTUAL FUND INVESTMENTS ARE SUBJECT TO MARKET RISKS, READ ALL SCHEME RELATED DOCUMENTS CAREFULLY .

Disclaimers: The views, facts and figures in this document are as of January 31, 2015, unless stated otherwise, and could change without any notice. These views alone are not sufficient and should not be used for the development or implementation of an investment strategy. Neither the Sponsors/the AMC/ the Trustee Company/ their associates/ any person connected with it, accepts any liability arising from the use of this information. While utmost care has been exercised while preparing the document, the Sponsors/the AMC/ the Trustee Company/ their associates/ any person connected with it, do not warrant the completeness or accuracy of the information and disclaim all liabilities, losses and damages arising out of the use of this information. The recipients of this material should rely on their investigations and take their own professional advice. Statutory Details: Constitution: Union KBC Mutual Fund has been set up as a Trust under the Indian Trusts Act, 1882; Settlors / Sponsors: Union Bank of India and KBC Participations Renta, a 100% subsidiary of KBC Asset Management NV; Trustee: Union KBC Trustee Company Private Limited [Corporate Identity Number (CIN): U65923MH2009PTC198198], a company incorporated under the Companies Act, 1956 with a limited liability; Investment Manager: Union KBC Asset Management Company Private Limited [Corporate Identity Number (CIN): U65923MH2009PTC198201], a company incorporated under the Companies Act, 1956 with a limited liability. The information in this document is as on 31st January 2015 and may change without notice. Copy of all Scheme related documents along with the application form can be obtained from any of our AMC offices/ Customer Service Centers/ distributors as well as from our website www.unionkbcmf.com. The Mutual Fund/AMC and its empanelled broker(s) has not given and shall not give any indicative portfolio and indicative yield in any communication, in any manner whatsoever. Investors are advised not to rely on any communication regarding indicative yield/ portfolio with regard to the scheme.

Details & Disclaimers

19

slide-20
SLIDE 20

Thank You