SLIDE 1
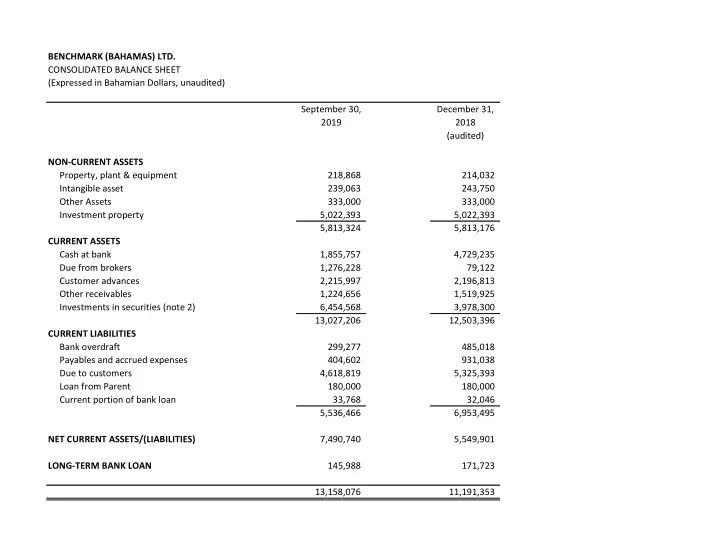
BENCHMARK (BAHAMAS) LTD. CONSOLIDATED BALANCE SHEET (Expressed in Bahamian Dollars, unaudited) September 30, December 31, 2019 2018 (audited) NON-CURRENT ASSETS Property, plant & equipment 218,868 214,032 Intangible asset 239,063 243,750 Other Assets 333,000 333,000 Investment property 5,022,393 5,022,393 5,813,324 5,813,176 CURRENT ASSETS Cash at bank 1,855,757 4,729,235 Due from brokers 1,276,228 79,122 Customer advances 2,215,997 2,196,813 Other receivables 1,224,656 1,519,925 Investments in securities (note 2) 6,454,568 3,978,300 13,027,206 12,503,396 CURRENT LIABILITIES Bank overdraft 299,277 485,018 Payables and accrued expenses 404,602 931,038 Due to customers 4,618,819 5,325,393 Loan from Parent 180,000 180,000 Current portion of bank loan 33,768 32,046 5,536,466 6,953,495 NET CURRENT ASSETS/(LIABILITIES) 7,490,740 5,549,901 LONG-TERM BANK LOAN 145,988 171,723 13,158,076 11,191,353
SLIDE 2
Shareholders' Equity Ordinary shares 49,591 49,591 Preference shares 5,000,000 5,000,000 Contributed surplus 4,056,273 4,056,273 Retained earnings/(deficit) 4,052,212 2,085,489 13,158,076 11,191,353
SLIDE 3 BENCHMARK (BAHAMAS) LTD. CONSOLIDATED STATEMENT OF OPERATIONS (Expressed in Bahamian Dollars, unaudited) September 30, 2019 September 30, 2018 Commission 5,763 11,758 Portfolio management and advisory fees 578,198 407,433 Rental income 104,901 95,751 Dividends 16,020 17,265 Consultancy & Management Services 24,360 2,000 Administrative & Maintenance Services 6,000 3,000 Interest 8,948 6,757 744,190 543,964 General administrative expenses Commission expense
Salaries and benefits 151,323 167,527 Travel and entertainment 3,349
27,165 23,203 Investment advisor fee 25,000 25,000 Bank charges and interest 25,343 22,169 Liability insurance 1,688
- Cleaning, repairs and maintenance
44,328 26,074 Depreciation and amortization 24,234 19,661 Corporate management fees 2,325 8,244 Directors' and officers' fees 10,000 12,250 Bad debts provision
8,650 420 Utilities 19,531 9,529 Business licence fees 19,377 26,788 Real property tax 6,864 9,228 Three months ended
SLIDE 4 Securities Commission licence fees 9,213 16,967 Property insurance
Property management fee 6,250 6,250 Dues & Subscriptions 31,713 16,277 Printing and stationery 15,032 2,063 BISX listing fees 1,250 1,250 Registrar & Transfer Agent fees 3,806
22,531 37,277 458,973 443,757 Net investment income 285,217 100,207 Realized and unrealized gain and loss
Net realized gain/(loss) on investment 257,186 224,946 Net movement in unrealized gain
732,581 (482,708) Net realized gain on foreign exchange (388)
- Net realized and unrealized gain
- n investments
989,380 (257,762) Net profit for the period 1,274,597 (157,555) Earnings per share $0.26 ($0.03)
SLIDE 5 BENCHMARK (BAHAMAS) LTD. CONSOLIDATED STATEMENT OF OPERATIONS (Expressed in Bahamian Dollars, unaudited) September 30, 2019 September 30, 2018 Commission 66,335 97,755 Portfolio management and advisory fees 1,269,284 1,655,065 Rental income 312,203 288,503 Dividends 63,804 70,191 Consultancy & Management Services 73,080 2,000 Administrative & Maintenance Services 18,000 9,000 Interest 18,314 9,668 1,821,022 2,132,183 General administrative expenses Commission expense
426,503 424,705 Travel and entertainment 20,806
79,470 62,920 Investment advisor fee 75,000 75,000 Bank charges and interest 94,543 43,765 Liability insurance 5,063
- Cleaning, repairs and maintenance
108,601 98,700 Depreciation and amortization 71,283 59,699 Corporate management fees 6,975 14,400 Directors' and officers' fees 30,000 32,250 Public relations 12,105 420 Utilities 49,874 25,799 Business licence fees 34,794 78,029 Real property tax 20,669 28,823 Securities Commission licence fees 27,638 32,267 Nine months ended
SLIDE 6 Property insurance
Property management fee 18,750 18,750 Dues & Subscriptions 71,180 29,425 Printing and stationery 27,427 6,696 BISX listing fees 3,750 3,750 Registrar & Transfer Agent fees 11,419 11,419 Miscellaneous 44,200 73,872 1,240,049 1,138,629 Net investment income 580,973 993,554 Realized and unrealized gain and loss
Net realized gain on investment 627,835 230,945 Net movement in unrealized gain
858,109 (884,937) Net realized foreign exchange gain (1,012)
- Net realized and unrealized gain
- n investments
1,484,932 (653,992) Net profit for the period 2,065,904 339,562 Earnings per share $0.42 $0.07
SLIDE 7 BENCHMARK (BAHAMAS) LTD. CONSOLIDATED STATEMENT OF CHANGES IN SHAREHOLDERS' EQUITY nine months ended September 30, 2019 with compararive figures for the nine months ended September 30, 2018 (Expressed in Bahamian Dollars, unaudited) Number Ordinary Preference Contributed Retained
Shares Shares Shares Earnings Total Balance at December 31, 2017 4,959,111 49,591 5,000,000 4,056,273 3,361,241 12,467,105 Dividends Paid
(49,591) Net profit for the period
339,562 Balance at September 30, 2018 4,959,111 $49,591 $5,000,000 $4,056,273 $3,651,211 $12,757,075 Balance at December 31, 2018 4,959,111 49,591 5,000,000 4,056,273 2,085,489 11,191,353 Dividends Paid
(99,182) Net profit for the period
2,065,904 Balance at September 30, 2019 4,959,111 $49,591 $5,000,000 $4,056,273 $4,052,212 $13,158,076
SLIDE 8 BENCHMARK (BAHAMAS) LTD. CONSOLIDATED STATEMENT OF CASH FLOWS (Expressed in Bahamian Dollars, unaudited) September 30, 2019 September 30, 2018 Cash flows from operating activities: Net profit for the period 2,065,904 339,562 Adjustments for: Net realized gain (627,835) (230,945) Net movement in unrealized gain on investments (858,109) 884,937 Depreciation and amortization 71,283 59,699 Cash provided by operations before changes in operating assets and liabilities 651,244 1,053,252 (Increase)/decrease in other assets
- (Increase)/decrease in customer advances
(19,184)
- (Increase)/decrease in other receivables
295,269 (408,255) Increase in payables and accrued expenses (526,436) (527,448) Increase in due to customers (706,574) (5,786,811) Net cash provided by operating activities (305,681) (5,669,262) Cash flows from investing activities: Purchase of securities (2,798,054) (49,817) Sale of securities 1,807,729 51,347 Purchase of property, plant & equipment (71,431) (49,344) Purchase of intangible assets
Purchase of other assets
Addition to investment property
Net cash (used)/provided by investing activities (1,061,755) (447,507) Nine months ended
SLIDE 9
Cash flows from financing activities: Bank loan repayment (24,013) (22,302) Dividends Paid (99,182) (49,591) Net cash provided/(used) by financing activities (123,195) (71,893) Net increase in cash & cash equivalent (1,490,631) (6,188,662) Cash & cash equivalents, beginning of period 4,323,340 14,510,180 Cash & cash equivalents, end of period 2,832,709 8,321,518 Cash & cash equivalents comprise of cash at bank and brokers less bank overdraft and amounts due to brokers.
SLIDE 10 BENCHMARK (BAHAMAS) LTD. EXPLANATORY NOTES TO INTERIM CONSOLIDATED FINANCIAL STATEMENTS (Expressed in Bahamian Dollars, unaudited) 1. Accounting policies These interim financial statements have been prepared in accordance with International Financial Reporting Standards using the same accounting policies and methods of computation as compared with the 2017 audited financial statements. The consolidated financial statements include the accounts of Benchmark (Bahamas) Ltd. and its wholly owned subsidiaries Benchmark Advisors (Bahamas) Ltd., Alliance Investment Management
- Ltd. ("Alliance"), Benchmark Properties Ltd. ("Properties") and Benchmark Ventures Ltd. ("Ventures").
2. Investments Investments are comprised of publicly traded equities in the following industries: Industry Cost Fair % Cost Fair Value % Unrestricted Biotechnology 1,899
139,661 17,584 139,661 17,584 Financial services 703,429 3,109,815 85 661,086 3,401,653 86 Industrial 930,157 255,200 7 967,507 276,378 7 Insurance 215,305 1,420 215,305 1,301 Technolgy 11,580
78,606 49,256 1 78,606 36,383 1 Wholesale & retail 78,958 74,505 2 78,958 80,502 2 Other 31,105 146,771 4 126,346 164,499 4 2,190,700 3,654,552 100 2,280,948 3,978,300 100 September 30, 2019 December 31, 2018