SLIDE 1
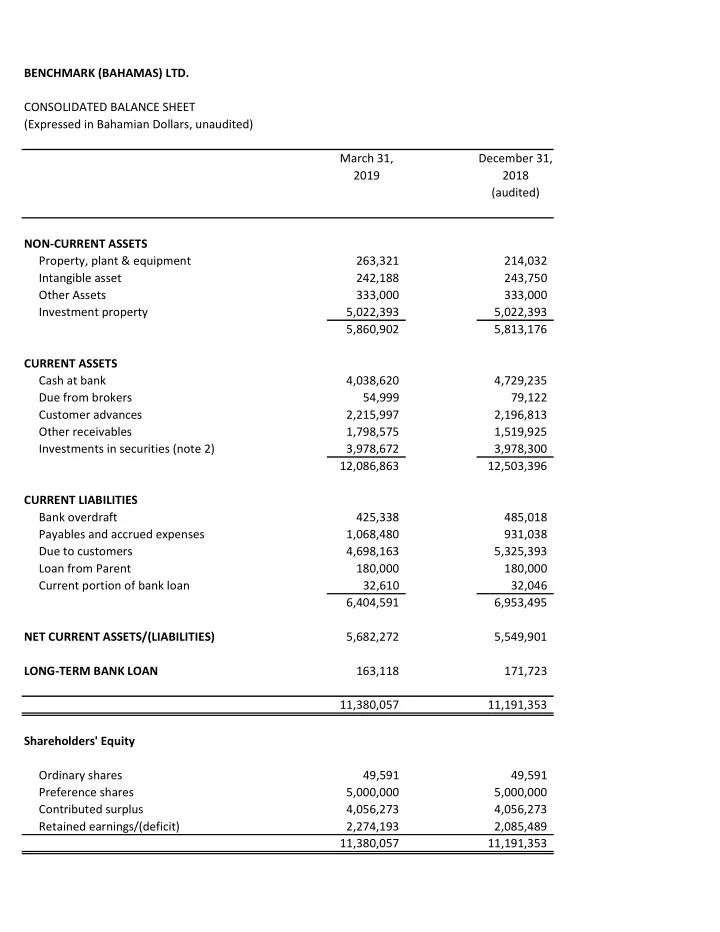
BENCHMARK (BAHAMAS) LTD. CONSOLIDATED BALANCE SHEET (Expressed in Bahamian Dollars, unaudited) March 31, December 31, 2019 2018 (audited) NON-CURRENT ASSETS Property, plant & equipment 263,321 214,032 Intangible asset 242,188 243,750 Other Assets 333,000 333,000 Investment property 5,022,393 5,022,393 5,860,902 5,813,176 CURRENT ASSETS Cash at bank 4,038,620 4,729,235 Due from brokers 54,999 79,122 Customer advances 2,215,997 2,196,813 Other receivables 1,798,575 1,519,925 Investments in securities (note 2) 3,978,672 3,978,300 12,086,863 12,503,396 CURRENT LIABILITIES Bank overdraft 425,338 485,018 Payables and accrued expenses 1,068,480 931,038 Due to customers 4,698,163 5,325,393 Loan from Parent 180,000 180,000 Current portion of bank loan 32,610 32,046 6,404,591 6,953,495 NET CURRENT ASSETS/(LIABILITIES) 5,682,272 5,549,901 LONG-TERM BANK LOAN 163,118 171,723 11,380,057 11,191,353 Shareholders' Equity Ordinary shares 49,591 49,591 Preference shares 5,000,000 5,000,000 Contributed surplus 4,056,273 4,056,273 Retained earnings/(deficit) 2,274,193 2,085,489 11,380,057 11,191,353