
SLIDE 1
SolarPACES Conference, 16-19 September 2014, Beijing, China [1]
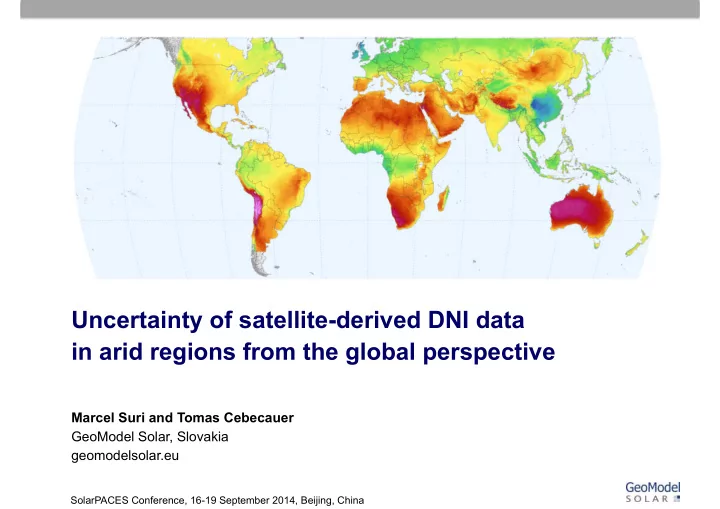
Uncertainty of satellite-derived DNI data in arid regions from the global perspective
Marcel Suri and Tomas Cebecauer GeoModel Solar, Slovakia geomodelsolar.eu
SolarPACES Conference, 16-19 September 2014, Beijing, China