
SLIDE 1
UMS Enrollment UMA UMaine Predicted Influence of External Factors - - PowerPoint PPT Presentation
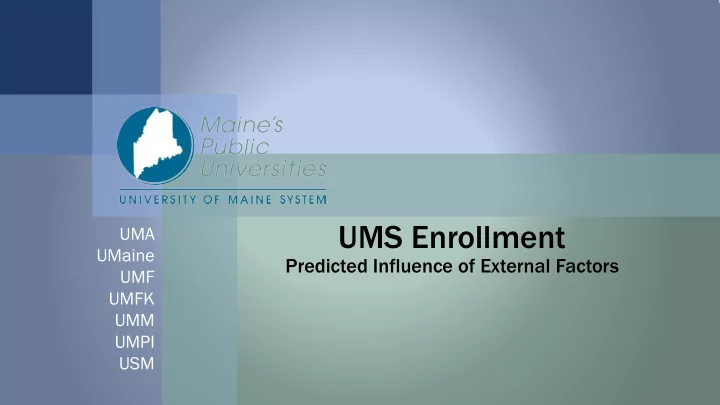
UMS Enrollment UMA UMaine Predicted Influence of External Factors UMF UMFK UMM UMPI USM Outlook External Factors Prior Year High School Grauates Prior Year Maine CPI VS Undergraduate Enrollment VS Undergraduate Enrollment 680,000
2
195.0 200.0 205.0 210.0 215.0 220.0 225.0 230.0 235.0 240.0 560,000 580,000 600,000 620,000 640,000 660,000 680,000 2009 2010 2011 2012 2013 2014 2015 2016 2017
Prior Year Maine CPI VS Undergraduate Enrollment
Undergraduate PY_ME_CPI 10,000 10,500 11,000 11,500 12,000 12,500 13,000 13,500 14,000 14,500 15,000 560,000 580,000 600,000 620,000 640,000 660,000 680,000 2009 2010 2011 2012 2013 2014 2015 2016 2017
Prior Year High School Grauates VS Undergraduate Enrollment
Undergraduate PY HS GRAD 44,000 46,000 48,000 50,000 52,000 54,000 56,000 58,000 60,000 560,000 580,000 600,000 620,000 640,000 660,000 680,000 2009 2010 2011 2012 2013 2014 2015 2016 2017
Maine GDP VS Undergraduate Enrollment
Undergraduate Maine GDP
Do the external factors used by other Universities fit UMS Enrollment Data. The Answer is: Very Closely
3
600,000 620,000 640,000 660,000 680,000 700,000 720,000 740,000
100,000,000 150,000,000 200,000,000 250,000,000 300,000,000 2009 2010 2011 2012 2013 2014 2015 2016 2017
Weighted and Unweighted Billed Credit Hours
Weighted in tuition dollars
Weighted 2017 Value UnWeighted 160 180 200 220 240 260 280 2008 2013 2018 2023 MAINE CPI YEARS
Maine CPI
Actual Rob's Forecast CEFC
4
2 4 6 8 10 12 14 16 2008 2013 2018 2023
Number of HS Graduates Thousands Years
Maine Prior Year High School Graduation Count
High School Prediction 5000 10000 15000 20000 25000 30000 35000 40000 2010 2011 2012 2013 2014 2015 2016 2017
Full Year Headcount Years Source: IPEDS
Maine Market Share Four Year and Above
UMS Competition 14.187 13.174 8076 57% 57% 8179 62% 62% 67% 72% 2 4 6 8 10 12 14 16 2005 2006 2007 2008 2009 2010 2011 2012 2013 2014
Thousands
College-Going in the Fall Semester after High School Graduation in Maine
Total in the class Enrolled in college Maine colllege College outside Maine
DOE & Mitchell Institute: https://assets.documentcloud.org/documents/1238800/college-going-in-maine-july-2014-data-brief.pdf DOE & Mitchell Institute
5
10 20 30 40 50 60 70 2005 2010 2015 2020 2025
Credit Hours Thousands Years
Graduate Billed Credit Hours
Graduate Prediction 100 200 300 400 500 600 700 2005 2010 2015 2020 2025
Credit Hours Thousands Years
Undergraduate Billed Credit Hours
Undergraduate Prediction
Data doesn’t define destiny: New actions/programs can break trends. Model Predicts -7% Reduction in Billed Credit Hours
6
50 100 150 200 2008 2013 2018 2023
Credit Hours Thousands Years
In-State Undergraduate Billed Credit Hours
Undergraduate Prediction 5 10 15 20 25 2008 2013 2018 2023
Credit Hours Thousands Years
Out of State Undergraduate Billed Credit Hours
Undergraduate Prediction Alternate 5 10 15 20 25 30 35 2008 2013 2018 2023
Credit Hours Thousands Years
In-State Graduate Billed Credit Hours
Graduate Prediction 1 2 3 4 5 6 7 2008 2013 2018 2023
Credit Hours Thousands Years
Out of State Graduate Billed Credit Hours
Graduate Prediction 1,700 1,750 1,800 1,850 1,900 1,950 2,000 2008 2013 2018 2023
Graduates Years
UMS High School Feeder PY Graduate Count
HS Feeder Prediction
High S School
Feeders U Used: Bonny Eagle High School Deering High School Gorham High School Portland High School Sanford High School Scarborough High School Thornton Academy Windham High School
7
High S School
Feeders U Used: Ashland District School Caribou High School Central Aroostook Jr-Sr H S Fort Fairfield Middle/High School Hodgdon Middle/High School Houlton High School Limestone Community School ME Sch of Science & Mathematics Presque Isle High School So Aroostook School Washburn District High School
5 10 15 20 25 30 2008 2013 2018 2023
Credit Hours Thousands Years
In-State Undergraduate Billed Credit Hours
Undergraduate Prediction Alternate 2 4 6 8 10 12 2008 2013 2018 2023
Credit Hours Thousands Years
Out of State Undergraduate Billed Credit Hours
Undergraduate Prediction Alternate 100 200 300 400 500 600 2008 2013 2018 2023
Graduates Years
Presque Isle High School Feeders Prior Year Graduaton Count
HS Feeders Prediction
8
50 100 150 200 250 2008 2013 2018 2023
Credit Hours Thousands Years
In-State Undergraduate Billed Credit Hours
Undergraduate Prediction 20 40 60 80 100 120 2008 2013 2018 2023
Credit Hours Thousands Years
Out of State Undergraduate Billed Credit Hours
Undergraduate Prediction 5 10 15 20 25 2008 2013 2018 2023
Credit Hours Thousands Years
In-State Graduate Billed Credit Hours
Graduate Prediction 2 4 6 8 10 2008 2013 2018 2023
Credit Hours Thousands Years
Out of State Graduate Billed Credit Hours
Graduate Prediction
High S School
Feeders U Used: Bonny Eagle High School Deering High School Gorham High School Portland High School Sanford High School Scarborough High School Thornton Academy Windham High School
1600 1650 1700 1750 1800 1850 1900 2008 2013 2018 2023
Graduates Years
UM High School Feeders Prior Year Graduate Count
HS Graduates Prediction
9
High S School
Feeders U Used: Caribou High School Hermon High School Houlton High School Leavitt Area High School Lewiston High School Madawaska Middle/High School Presque Isle High School Wisdom Middle High School
5 10 15 20 25 30 35 2008 2013 2018 2023
Credit Hours Thousands Years
In-State Undergraduate Billed Credit Hours
Undergraduate Prediction 1 2 3 4 5 6 7 8 2008 2013 2018 2023
Credit Hours Thousands Years
Out of State Undergraduate Billed Credit Hours
Undergraduate Prediction Alternate 100 200 300 400 500 600 700 800 900 1000 2008 2013 2018 2023
Graduates Years
Fort Kent High School Feeders Prior Year Graduate Count
Graduates Prediction
10
10 20 30 40 50 60 70 80 90 100 2008 2013 2018 2023
Credit Hours Thousands Years
In-State Undergraduate Billed Credit Hours
Undergraduate Prediction 200 400 600 800 1000 1200 1400 1600 1800 2008 2013 2018 2023
Graduates Years
Augusta High School Feeders Prior Year Graduate Count
Graduates Prediction
High S School
Feeders U Used: Bangor High School Camden Hills Regional Erskine Academy Gardiner Area High School Maranacook Community High Medomak Valley High School Messalonskee High School Oxford Hills Comprehensive H S
1 1 2 2 3 3 4 4 5 2008 2013 2018 2023
Credit Hours Thousands Years
Out of State Undergraduate Billed Credit Hours
Undergraduate Prediction
11
High S School
Feeders U Used: Erskine Academy Lawrence High School Lewiston High School Messalonskee High School Mt Abram Regional High School Mt Blue High School Oxford Hills Comprehensive H S Poland Regional H S Skowhegan Area High School Thornton Academy
20 30 40 50 60 2008 2013 2018 2023
Credit Hours Thousands Years
In-State Undergraduate Billed Credit Hours
Undergraduate Prediction
4 6 8 10 12 14 2008 2013 2018 2023
Credit Hours Thousands Years
Out of State Undergraduate Billed Credit Hours
Undergraduate Prediction
1 2 2 3 3 4 4 2008 2013 2018 2023
Credit Hours Thousands Years
In-State Graduate Billed Credit Hours
Graduate Prediction
1 2 2 3 2008 2013 2018 2023
HS Graduates Thousands Years
UMF High School Feeder PY Graduation Count
Feeder HS Prediction
12
High S School
Feeders U Used: Calais Middle/High School Jonesport-Beals High School Machias Memorial High School Narraguagus High School Shead High School Sumner Memorial High School Washington Academy Woodland Jr-Sr High School
2 4 6 8 10 12 14 16 2008 2013 2018 2023
Credit Hours Thousands Years
In-State Undergraduate Billed Credit Hours
Undergraduate Prediction 1 1 2 2 3 3 4 4 5 2008 2013 2018 2023
Credit Hours Thousands Years
Out of State Undergraduate Billed Credit Hours
Undergraduate Prediction Alternate 50 100 150 200 250 300 350 400 450 2008 2013 2018 2023
Graduates Years
Machias High School Feeders Prior Year Graduate Count
Graduates Prediction