UK 2011 & Australia 2014 To Sit or Stand: What is Good for the - - PDF document

uk 2011 australia 2014
SMART_READER_LITE
LIVE PREVIEW

UK 2011 & Australia 2014 To Sit or Stand: What is Good for the - - PDF document

D Rempel 03/10/2017 UK 2011 & Australia 2014 To Sit or Stand: What is Good for the Heart? Public Health Guidelines UCSF OEM 03/10/2017 Adults should minimize the Sme spent being sedentary (siUng) for extended periods. David Rempel, MD,


slide-1
SLIDE 1

D Rempel 03/10/2017

To Sit or Stand: What is Good for the Heart?

UCSF OEM 03/10/2017

David Rempel, MD, MPH, CPE Professor Emeritus, Department of Medicine University of California San Francisco Professor, Department of Bioengineering University of California, Berkeley [I have nothing to disclose]

UK 2011 & Australia 2014 Public Health Guidelines

Adults should minimize the Sme spent being sedentary (siUng) for extended periods.

AMA 2013

Prolonged siUng, parScularly in work seUngs, can cause health problems. Businesses should offer employees alternaSves to siUng all day – such as standing desks, isometric balls instead of desk chairs, or re-arranging

  • ffice space and work habits to encourage more

movement during the day.

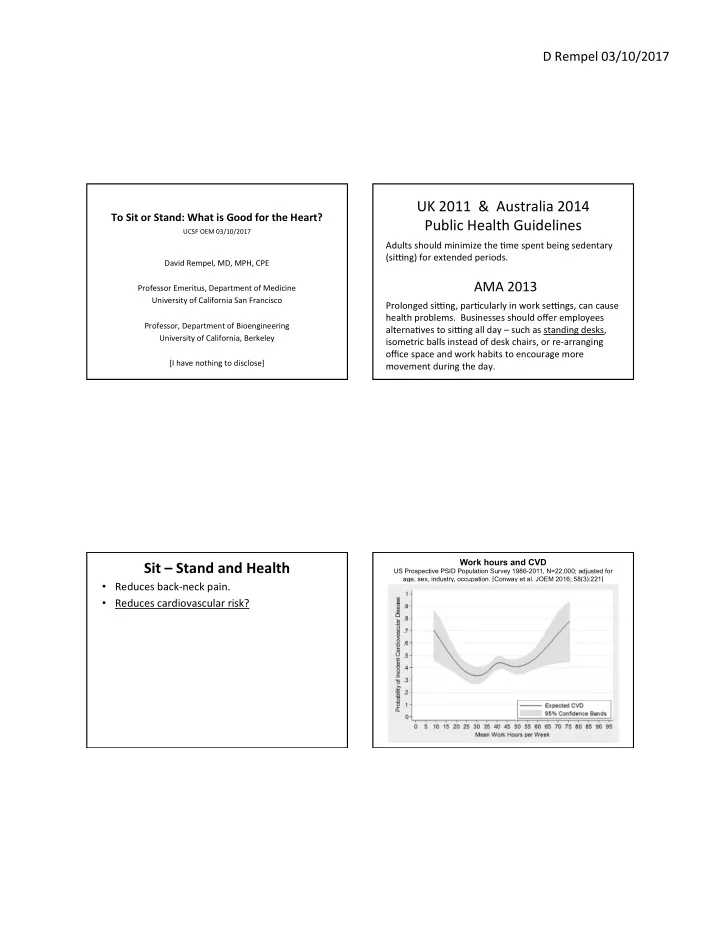
Sit – Stand and Health

  • Reduces back-neck pain.
  • Reduces cardiovascular risk?

Work hours and CVD

US Prospective PSID Population Survey 1986-2011, N=22,000; adjusted for age, sex, industry, occupation. [Conway et al. JOEM 2016; 58(3):221]

slide-2
SLIDE 2

D Rempel 03/10/2017

Church, Thomas, Tudor-Locke, et al. PLoS ONE, 2011

Predicted Weight Changes

Do sit-stand worksta>ons reduce CVD risk?

  • Does occupaSonal siUng Sme increase CVD?
  • Does occupaSonal physical acSvity decrease CVD?
  • Does occupaSonal standing increase CVD?
  • Does sit-stand reduce BMI?
  • Does sit-stand reduce blood pressure?
  • [OccupaSonal standing increases leg volume, leg

discomfort, and varicose veins]

Words

  • SiUng Sme
  • Standing Sme
  • Sedentary behavior
  • Physical inacSvity
  • No moderate-to-vigorous physical acSvity

Daily Standing Time and All-Cause Mortality

[Katzmarzyk 2009]

17,013 Canadians, ages 18-90, (41% of mortality = CVD), no adjustment for covariates ‘‘For those acSviSes which you do most days of the week (such as work, school and housework), how much Sme do you spend standing?’’

slide-3
SLIDE 3

D Rempel 03/10/2017

Daily Standing Time and All-Cause Mortality

[Katzmarzyk 2014]

Adjusted: age, smoking, alcohol, LTPA, physical acSvity readiness

Total SiUng Time & CVD (MI, CHD)

** OccupaSonal siUng Sme did not increase risk Adjustment: sex, age, employment, educaSon, smoking, LTPA, BMI, diet, alcohol, serum cholesterol, hypertension Study N Years Followed Age HR Comparison VanDerPloeg 2012 (Norway) 222,497 2.8 45-75 1.40 (1.27-1.55) >11 h/d Borodulin 2014 (Finland) 4,516 8.6 25-74 1.06 (1.01-1.11) h/d Petersen 2014 (Denmark) 71,363 5.4 18-99 1.59 (1.19-2.15) >10 h/d Maphews 2015 (USA) 154,614 6.8 59-82 1.42 (1.21-1.66) >12 h/d Chau 2015 ** (Norway) 50,817 3.3 20-75 1.65 (1.24-2.21) >10 h/d

OccupaSonal SiUng Time & CVD (MI, CHD)

* Office workers Adjustment: sex, age, employment, educaSon, SES, smoking, LTPA, BMI, alcohol, serum cholesterol, hypertension, waist circumference, CVD at baseline Study N Years Followed Age HR Comparison Stamatakis 2013 (UK) 10,834 12.9 >40 0.94 (0.67-1.33) v Stand-walk Kikuchi 2015 (Japan) – Male* 15,863 10.0 40-74 0.87 (0.75-1.01) >3 h/d Kikuchi 2015 (Japan) –Female* 12,005 10.2 40-74 1.03 (0.77-1.39) >3 h/d Moller 2016 (Denmark) 154,840 12.2 21-70 0.99 (0.92-1.06) per 10 h/w

London Bus Drivers Study

Morris J et al., Lancet 1953.

Drivers at increased risk for incident CHD compared to conductors: 2.7 v 1.9/1000. “Differences due to differences in physical acSvity”

slide-4
SLIDE 4

D Rempel 03/10/2017

London Bus Drivers Study

Morris J et al., Lancet 1953.

Drivers at increased risk for incident CHD compared to conductors: 2.7/1000 vs 1.9. “Differences due to differences in physical acSvity” No control for stress, BP, smoking, or BMI Urban bus drivers have elevated BP.

5

LTPA and CVD: Meta-analysis

[Li et al., 2013]

  • 23 prospecSve studies
  • 790,000 adults
  • 22,000 incidents
  • Confounders controlled
  • Moderate level LTPA

reduced CVD risk 20-30%

  • High level LTPH

reduced CVD risk 30-40%

Leisure Time Physical Ac>vity (LTPA) Reduces CVD

Occupa>onal Physical Ac>vity (OPA) Does Not

[Li et al. Current Opinion in Cardiology. 28(5):575-583, 2013]

  • 7 prospecSve studies with adjustment for covariates
  • Moderate OPA increased risk 5-15%
  • High OPA increased risk 10-30%

The OPA – LTPA Health Paradox

  • SystemaSc Review (Li 2013): OPA is bad & LTPA is good
  • Belgian cohort (Clays 2012): OPA is bad & LTPA is only good

for those with low OPA (OPA*LTPA InteracSon)

  • StaSc OPA increases BP & dynamic LTPA exercise reduces

BP – a possible explanaSon for the paradox ? (Clays 2013)

  • Finnish cohort (Krause 2015): OPA (energy expenditure, kcal)
  • r relaSve aerobic workload (% VO2max) predict 20-year

incidence of AMI. LTPA no effect.

slide-5
SLIDE 5

D Rempel 03/10/2017 Does aerobic exercise at work increase fitness ?

[Korshøj Met al., SJWEH 2014, EJAP 2015, IAOEH 2016, PLoS 2016]

  • YES, aerobic exercise (4 mo; 30 min x 2/wk) RCT

among Danish cleaners: increased fitness & reduced HR & reduced C-reacSve protein and LDL.

  • BUT increased resSng and ambulatory SBP (5 mm

HG), especially axer work (10 mmHG) among the workers who exceeded relaSve aerobic workload recommendaSons (30% VO2max).

Standing at Work Increases CVD

Standing Increases Caro>d Athersclerosis

4-year Change of Caro>d In>ma Media Thickness (IMT), adjusted for Age, Technical, Physical and Psychosocial Job Factors, Income, Biological and Behavioral Factors: Men with IHD

0.1 0.2 0.3 0.4 0.5 0.6 0.7 0.8 none little quite a lot very much

Adjusted Mean Change in IMT (mm) Standing at Work

Krause et al., Scand J Work Environ Health, 2000

0.08 0.15 0.37 0.75 0.09 0.15 0.38 0.74

0.1 0.2 0.3 0.4 0.5 0.6 0.7 0.8

none/none little/ low T quite a lot/ mid T very much/ upper T

Adjusted Mean Change in IMT (mm) Standing Smoking

Standing at Work / Smoking Krause et al., Scand J Work Environ Health, 2000

Standing compared to Smoking

slide-6
SLIDE 6

D Rempel 03/10/2017

Pictures of acSve workstaSons

NEPA: Non-exercise physical ac5vity

[Levine AJCN 2000]

kcal/h SD Lying down 77 22 SiUng moSonless 80 23 Standing moSonless 87 24 SiWng & Fidge>ng 118 33 Standing & Fidge>ng 148 42 Walking (1.6 km/h) 196 62 Walking (3.2 km/h) 235 77 Walking (4.8 km/h) 305 113

NEPA: Non-exercise physical ac5vity

Tudor-Locke C et al, Int J Obesity 2014

Standing v SiUng Treadmill Walking v SiUng Seated Pedaling v SiUng 0 kcal/h (C: Speck 2011) 120 kcal/h 56 kcal/h 4 kcal/h (Beers 2008) 20 kcal/h (B: Reiff 2012)

Use of Sit-Stand WorkstaSons

  • Sit-stand workstaSons lead to increased

standing 50-70 minutes per day.

slide-7
SLIDE 7

D Rempel 03/10/2017

Does Work NEPA reduce Blood Pressure? 8 week RCT [Graves et al, 2015]

Control (N=21)

SiUng 402 min/d Standing 44 min/d Walking 34 min/d

Sit-Stand Desk (N=23)

Δ SiUng

  • 87.6 min/d

Δ Standing 72.9 min/d Δ Walking 7.1 min/d Δ Glucose

  • 0.09 mmol/L

Δ Triglycerides 0.11 mmol/L Δ Cholersterol -0.40 mmol/L Δ SBP

  • 1.6 mmHg

Δ DBP

  • 2.5 mmHg

[All differences NS]

SiUng and Lipid Profiles

[Saidj 2013]

  • Danish working adults; N=2544; 18-69 yo
  • Leisure Sme siUng (3.1h) assoc with increased TGs,

cholesterol, body fat, BMI, waist circumference. (no assoc with Hgb A1c, Plasma glucose)

  • OccupaSonal Sme siUng (4.1h) no associaSons
  • Adjusted: sex, age, ed, smoking, alcohol, diet, PA

Does Work NEPA reduce Blood Pressure? 4 month RCT [Mainsbridge, JOEM 2014]

  • Every hour soxware prompt to stand up and move
  • NEPA of 8 minutes/day reduced resSng mean arterial

pressure (MAP) by 10 mmHg axer 4 months.

  • Strength: RCT
  • Limita5ons:
  • small samples (N=11+18)
  • randomizaSon not successful (controls 5.5 years older)
  • no blinding
  • no age-adjustment
  • no between group-effects analyzed, only pre-post

Church, Thomas, Tudor-Locke, et al. PLoS ONE, 2011

Predicted Weight Changes

slide-8
SLIDE 8

D Rempel 03/10/2017

Church, Thomas, Tudor-Locke, et al. PLoS ONE, 2011

Increasing OccupaSonal SiUng Causing Obesity Epidemic? Increasing OccupaSonal SiUng Causing Obesity Epidemic? Trends in sedentary, light and moderate intensity occupaSons

Church, Thomas, Tudor-Locke, et al. PLoS ONE, 2011

  • 140 daily kcals
  • 120 daily kcals

Increasing OccupaSonal SiUng Causing Obesity Epidemic? Daily OccupaSonal Energy Expenditure

Church, Thomas, Tudor-Locke, et al. PLoS ONE, 2011

US Caloric ConsumpSon per Day

+900 daily kcals USDA, NHANES

slide-9
SLIDE 9

D Rempel 03/10/2017

Conclusions

  • All Sme siUng increases CVD
  • OccupaSonal siUng does not increases CVD
  • Standing at work increases CVD
  • OccupaSonal physical acSvity does not decrease CVD
  • No evidence that sit-stand workstaSons decrease CVD
  • Metabolism é w standing inadequate to decrease BMI
  • Standing NEPA effects on BP uncertain
  • Sit-stand workstaSons may be beneficial for LBP
  • 1. Typically, with reminder soxware, for

how many minutes per day are sit-stand workstaSons used for standing?

  • A. 0 to 40 minutes
  • B. 40 to 80 minutes
  • C. 80 to 120 minutes
  • D. 120 to 160 minutes
  • 2. Standing, as compared to siUng,

increases caloric consumpSon by

  • A. 0 to 20 kcal/h (a packet of sugar)
  • B. 20 to 40 kcal/h (a plum)
  • C. 40 to 60 kcal/h (1 tofu dog)
  • D. 60 to 80 kcal/h (a very very light beer)
  • 3. Treadmill desks are welcome in open
  • ffice seUngs because
  • A. They are quiet
  • B. They are safe
  • C. They increase metabolism
  • D. It is easy to see who is using them
slide-10
SLIDE 10

D Rempel 03/10/2017

References: Sit-Stand

  • American Heart AssociaSon Science Advisory. Sedentary Behavior and Cardiovascular

Morbidity and Mortality. CirculaSon 2016; 134: (ePub).

  • Borodulin et al. Daily sedentary Sme and risk of cardiovascular disease: the NaSonal FINRISK

2002 Study. J Phys Act Health 2014; 12(7):904-8.

  • Chau JY et al. Cross-secSonal associaSons of total siUng and leisure screen Sme with

cardiometabolic risk in adults, Results from the HUNT Study. J Sci Med Sport 2015; 17:78-84.

  • Church TS et al. Trends over 5 decades in US occupaSonal-related physical acSvity and their

associaSons with obesity. PLoS ONE 2011; 6(5):e19657.

  • Eklund et al. Does physical acSvity apenuate, or even eliminate, the detrimental associaSon of

siUng Sme with mortality? A harmonized meta-analysis… Lancet 2016; 388:1302-1310

  • Graves LEF et al. EvaluaSon of sit-stand workstaSons in an office seUng: a randomized

controlled trial. BMC Pub Health 2015; 15:1145.

  • Katzmarzyk P. Standing and mortality in a prospecSve cohort of Canadian adults. Med & Sci

Sports Exerc. 2014; 46(5):940-946.

  • Kikuchi et al. OccupaSonal siUng Sme and risk of all-cause mortality among Japanese workers.

SJWEH 2015; 41(6):519-528.

  • Korshøj et al., Does aerobic exercise improve or impair cardiorespiratory fitness and health

among cleaners? A cluster randomized controlled trial. SJWEH 2015; 41(2):140-152.

  • Krause et al. Standing at work and progression of caroSd atherosclerosis. SJWEH 2000; 26(3):

227-236.

References: Sit-Stand

  • Krause et al. OccupaSonal physical acSvity and 20-year incidence of acute myocardial

infarcSon: results from the Kuopio Ischemic Heart Disease Study. SJWEH 2015; 41(2):124-139.

  • Levine JA et al. Energy expenditure of nonexercise acSvity. Am J Clin Nutr 2000; 72:1451-4.
  • Li et al. Physical acSvity and risk of cardiovascular disease: what does the new epidemiological

evidence show? Curr Opin Cardiol 2013; 28(5):575-583.

  • Mainsbridge CP et al. The effect of an e-Health intervenSon designed to reduce prolonged
  • ccupaSonal siSng on mean arterial pressure. JOEM 2014; 56(11):1189-1194.
  • Maphews CE et al. Mortality benefits for replacing siUng Sme with different physical acSviSes.

Med Sci Sports Exer 2015; 47(9):1833-40.

  • Moller SV et al. MulS-wave cohort study of sedentary work and risk of ischemic heart disease.

SJWEH 2016; 42(1):43-51.

  • Morris J et al., Coronary heart-disease and physical acSvity of work. Lancet 1953; 28: 1053-7

and 1111-20.

  • Petersen CB et al. Total siUng Sme and risk of myocardial infarcSon, coronary heart disease

and all-cause mortality in a prospecSve cohort of .... Int J Behav Nutr Phys Act 2014; 11:13.

  • Saidj M et al. Separate and joint associaSons of occupaSonal and leisure-Sme siUng with

cardio-metabolic risk factors. PLOS One 2013; 8(8):e70213.

  • Stamatakis E et al. Are siUng occupaSons associated with increased all-cause, canceter, and

cardiovascular disease mortality risk? A pooled analysis…. PLOS One 2013; 8(9):e73753.

  • Tudor-Locke C et al. Changing the way we work: elevaSng energy expenditure with workstaSon
  • alternaSves. Int J Obesity 2014; 38:755-765.