
SLIDE 1
8/7/2019 1
U.S. Dairy Sector at Crossroads
2019 Midsouth Ruminant Nutrition Conference Grapevine, TX August 7, 2019
- Dr. Marin Bozic
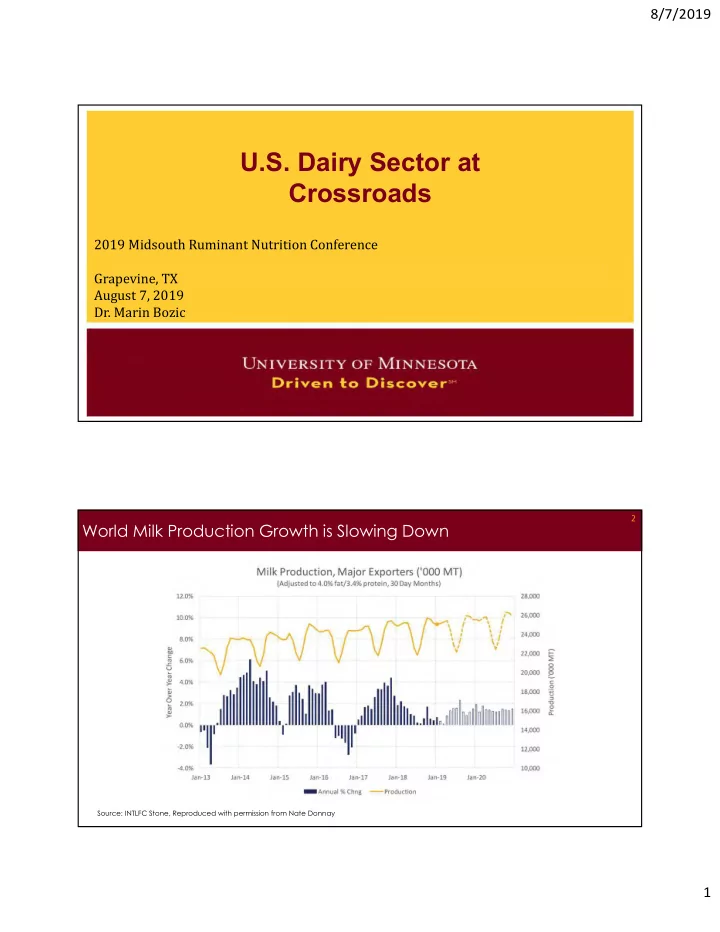
World Milk Production Growth is Slowing Down
2
Source: INTLFC Stone, Reproduced with permission from Nate Donnay