
SLIDE 1
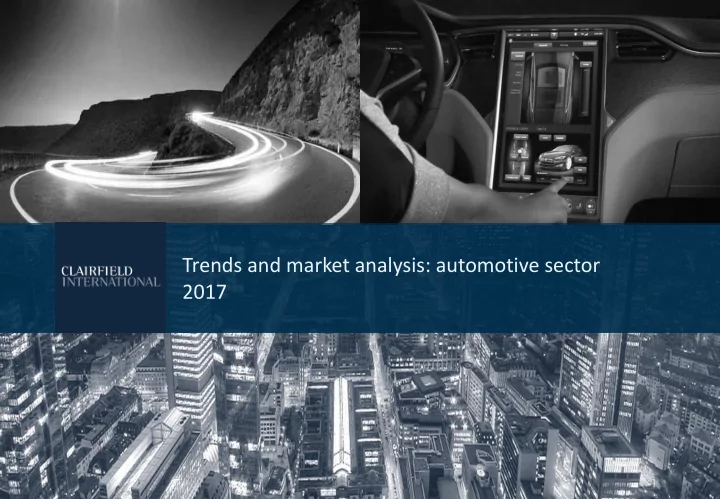
Trends and market analysis: automotive sector 2017 Executive - - PowerPoint PPT Presentation
Trends and market analysis: automotive sector 2017 Executive Summary Study focus This study gives a short overview of the automotive sector. In detail, the study shows the Global, European and German M&A market, European and German
2
This study gives a short overview of the automotive sector. In detail, the study shows the Global, European and German M&A market, European and German automotive market, and upcoming key trends. There is a general change from combustion engine to hybrid, electrical powertrain.
2016 decreased by 37% compared to H1 2015. Europe stayed the most active region for M&A activity with a decrease in volume and share of deal value
driver for the future: 7.7 million more cars will be assembled for China until 2022
growing market, until 2030 it is estimated to become a $600bn market. Autonomous driving is the highlight project and is becoming an important purchase criteria for the future, 62% of the CEOs expect it. The number of new registered hybrid- and electro vehicles are expected to increase by more than 75% in the three global markets EU, NAFTA and China.
Production in global automotive assembly – a forecast until 2022
55 56 58 63 65 69 66 58 72 75 80 84 86 88 92 95 99 105 107 110 111 621 588 515 584 594 604 549 532 250 594 490 465 543 591 552
400 600 800 1.000 20 40 60 80 100 120 2002 2003 2004 2005 2006 2007 2008 2009 2010 2011 2012 2013 2014 2015 2016 2017 2018 2019 2020 2021 2022 Deal volume Assembly volumes (millions) Global light vehicles assembly outlook Automotive M&A deal volume
Sources: PwC
Dirk Freiland - Managing Partner Dirk Freiland has 18 years of experience in M&A and studied mechanical engineering, electronics and computer science. He has advised transactions in the automotive sector with significant repeat. Dirk Middelhoff - Managing Partner Dirk Middelhoff holds a degree in Business Law (LL.B) with a focus on corporate finance and more than 15 years experience in corporate finance, business development and strategy.
Executive Summary 2 A. Global M&A trends and update of the first half of 2016 4 First half of 2016: M&A activity in the automotive sector 6 M&A transaction highlights of the first half of 2016 automotive sector 8 B. Analysis of the automotive sector Worldwide, in Europe, and in Germany 12 Global automotive assembly – a forecast until 2022 13 Overview of automotive market in Europe 14 Overview of automotive market in Germany 15 C. Automotive strategic trends Worldwide, Europe and Germany 18 A classification of vehicle components 19 Overview of the current automotive trends 20 Lightweight – first trend 21 Autonomous driving cars – second trend 23 Big data – third trend 24 Electric mobility – fourth trend 25 Case study – ElringKlinger 27 Conclusion of the trend analysis 28 D. Clairfield International at a glance 29 References automotive 35 General references 39 E. Clairfield International automotive sector team 46 Clairfield International team Germany 57 Contact 60
3
5
North America $5.92bn 87 deals 22.3% Rest of the World $3.9bn 33 deals 14.6% Europe $11.9bn 116 deals 44.8% Asia $4.9bn 61 deals 18.4%
value underperformed in relation to the first half of 2015 with a total amount of 257 deals
decreased by 7%
with 93 local deals, North America following second with 60 local deals, Asia showing consistency in its M&A trend with 51 local deals and ultimately the rest of the world with 13 local deals
was the weak economic environment and a general lower level in the M&A market
indicators are the large cash balance
companies and private equity, ongoing pressure from shareholders and competitors and the development of new technologies
deal volume and 75% of deal value or $16.1bn
half of 2016. The total value included 93 local deals ($8.2bn), 12 inbound deals ($3.7bn) and 10 outbound deals ($0.01bn)
activity with a decrease in volume and share of deal value
approximately 56%, that’s the highest gain since 2008 for the first half of 2016
target companies and in three out of six megadeals, a European company is the acquirer
export market is crucial, 57% of the exports go to Europe. There will be changes in expenditures for the Capex, R&D and Talent acquisition
6 Sources: Clairfield Expert Group and PwC
7
$18,8 $10,6 $13,1 $27,5 $34,1 $21,3 303 264 222 250 275 257 100 200 300 400 5 10 15 20 25 30 35 40 H1 2011 H1 2012 H1 2013 H1 2014 H1 2015 H1 2016 Deal volume Disclosed deal value ($bn) Disclosed deal value Deal volume $3,1 $4,4 $1,1 $13,4 $4,1 $2,4 52 42 30 24 33 25 10 20 30 40 50 60 H1 2011 H1 2012 H1 2013 H1 2014 H1 2015 H1 2016 2 4 6 8 10 12 14 16 Deal value in ($bn) Deal volume Disclosed deal value Deal volume $3,7 $4,7 $8,6 $10,1 $20,0 $10,1 144 137 100 117 84 85 20 40 60 80 100 120 140 160 00 05 10 15 20 25 H1 2011 H1 2012 H1 2013 H1 2014 H1 2015 H1 2016 Deal volume Deal value in ($bn) Disclosed deal value Deal volume $12,1 $1,6 $3,4 $4,0 $10,0 $8,9 107 85 92 109 159 147 50 100 150 200 00 02 04 06 08 10 12 14 H1 2011 H1 2012 H1 2013 H1 2014 H1 2015 H1 2016 Deal volume Deal value in ($bn) Disclosed deal value Deal volume
Sources: Clairfield Expert Group and PwC
8
The joint venture was established in 1998. A connection between both enterprise remains because Arcelor Mittal holds another investment of 35%
$1,135m. Both firms are active in the aftermarket for spare parts for commercial and non-commercial vehicles. LKQ Italia is a sub company of the LKQ Cooperation from North America and a leading distributor. LKQ is listed in the S&P 500
that wants to attack Uber’s market share. The business model is similar to Uber but the pricing is different. The investment is the way to digitalize the business from VW. The management from Wolfsburg failed to invest in Uber, Mytaxi or develop a share-service like Car2Go and DriveNow
SAS from France. ALD is a full leasing service provider for cars, with a fleet of 1.6 million vehicles in 41 countries and 5.000 employees
engineering a German specialist in design and engineering services. It is a strategic investment to gain access to German OEM’s and Tier 1 suppliers
LeasePlan Corp NV and LP Group BV; two European companies. LeasePlan is currently a full leasing service provider. The owner of VW and the bank of Metzler both held 50% of the shares and sold them to LP Group BV. The acquirer is a consortium of the Dutch pension fund PGGM, the Danish pension fond ATP, the pension fond GIC, Luxinva and TDR Capital LLP
Cie KG, a supplier for automotive transmission for about 2,666m. The investment was a strategic one, both companies are suppliers for the automotive sector. The German leader for dual-clutch transmissions has 14,000 employees and turned over $1.85bn in 2016. For Magna, it is a way to grow and an opportunity to establish in the sector of dual-clutch transmission, which will be a growing market in the future. Magna holds its market position as the second biggest supplier for the automotive sector behind BOSCH
Uber competitor. The investment carried an estimated value of $500m. GM is also trying to invest in the mobility of tomorrow. A full acquisition of the company failed recently as reported in the news
Sources: Clairfield Expert Group and PwC
Date effective Target Target region Acquirer name Acquirer region Category Transaction Value $m % of share acquire
3/2016 LeasePlan Corp NV Europe LP Group BV Europe Leasing Company 4,065 100 1/2016 GETRAG GmbH & Cie KG Europe Magna International Inc ROW Automotive Supplier 2,666 100 6/2016 Baoxin Auto Group Ltd Asia China Grand Automotive Services (Hong Kong) Ltd Asia Automobile Sales and Service Group 1,483 75 5/2016 Affinia Group, Inc. US MANN+HUMMEL GmbH Europe Automotive Supplier 1,335 100 5/2016 CGS Holding AS Europe Trelleborg AB Europe Supplier of Specialty Tires and Engineered Polymer Solutions 1,249 100 07/2016 Alliance Tire Group Europe The Yokohama Rubber Co., Ltd. Asia Supplier of Tires 1,179 100 3/2016 Rhino HoldCo Ltd Europe LKQ Italia S.r.l. Europe Distributor of spare parts 1,135 100 5/2016 Cruise Automation Inc US General Motors Co US Tech Startup (Autonomous driving) 1,000 100 2/2016 Gestamp Automocion SL Europe Corporacion Gestamp SL Europe Joint Venture 980 35 2/2016 Montupet SA Europe Linamar Corp ROW Automotive Supplier 960 100 6/2016 Key Safety Systems Inc US Ningbo Joyson Electronic Corp Asia Security Specialist 920 100 2/2016 The PEP Boys-Manny Moe & Jack US Icahn Enterprises LP US Full-service and Tire Automotive Aftermarket Chain 894 88 7/2016 Faurecia SA Europe Plastic Omnium Europe Automotive Supplier 754 100 1/2016 Huayu Automotive Sys Co Ltd Asia SAIC Motor Corp Ltd Asia Automotive Supplier 727 9 4/2016 Pittsburgh Glass Works LLC US LKQ Corp US Automotive Supplier 635 100 3/2016 Various component suppliers US Autoliv AB US Automotive Supplier 542 100 1/2016 Lyft Inc US General Motors Co. US Startup (share-mobility) 500 n.a. 2/2016 Various component suppliers US Haosheng Investment Co Ltd Asia Automotive Supplier 491 100 2/2016 Jiangsu JoylongAuto Co Ltd Asia Jiangxi Special Electric Motor Co Ltd Asia Automobile Manufacturer 340 67 5/2016 Parcours SAS Europe ALD Automotive Ltd Europe Leasing Company 334 100
Source: Thomson Reuters; Note: Deals included in this chart are those that have disclosed value 9
10 Date Bidder Target Country (Target) Stake Deal Value EV Revenue EV Multiples Sales EBITDA EBIT Jun 2016 Mubea Motorkomponenten GmbH Tubos Reunidos SA Spain 100 33 33 56 0.6 5 12.8 May 2016 Volkswagen AG Gett Inc. USA
Weber Automotive GmbH SaarOTEC GmbH Germany 84
BMW-Group AG Herald International Financial Leasing Co. Ltd. China 100
Weber Automotive GmbH SaarOTEC GmbH Germany 84
Schaeffler AG SIA Naco Technologies Latvia 100
Grammer AG REUM Kunststoff- und Metalltechnik GmbH Germany 100 50 50 117 0.4 4.1 5 Sep 2015 Porsche Automobil Holding SE Volkswagen AG Germany 2 523 34,867 203 0.7 5.1 10.6 Aug 2015 MANN+HUMMEL GmbH Affinia Group, Inc. Germany 100 1,204 1,204 798 1.4 10.8 12.5 May 2015 MAHLE GmbH Delphi Automotive Plc Germany 100 639 639 1,322 0.5 9.5 EV Multiples Revenue EBITDA EBIT Min 0.4 4.1 5 Median 0.6 5.1 11.6 Mean 0.7 6.9 10.2 Max 1.4 10.8 12.8 Date Bidder Target Country (Target) Stake Deal Value EV Revenue EV Multiples Sales EBITDA EBIT Nov 16 VBG Group AB Mobile Climate Control Group Holding AB Sweden 100 181 181 138 1.3 10.1 Aug 2016 Alliance Automotive Group Lookers Plc UK 100 140 140 297 0.5 8.2 9.5 July 2016 Valeo S.A. FTE automotive GmbH Germany 100 819 819 500 1.6 5.0 July 2016 Zhongding Holding Europe GmbH AMK Holding GmbH & Co. KG Germany 100 130 130 200 0.7 8.7 13.6 May 2016 CIE Automotive SA Grupo Amaya Telleria Germany 100 186 186 134 1.4 May 2016 Musashi Seimitsu Industry Co., Ltd HAY Holding GmbH Germany 100 361 361 524 0.7 11.3 Feb 2016 Ningbo Joyson Electronic Preh Holding GmbH TechniSat Automotive Germany 100 218 218 388 0.6 6.7 13.2 Jan 2016 Magna International Inc. GETRAG GmbH & Cie KG Germany 100 2,450 3,300 0.7 8.8
Mahindra & Mahindra Ltd. Pininfarina S.p.a. Italy 76 95 95 82 1.2 13.0 24.1 EV Multiples Revenue EBITDA EBIT Min 0.5 5.0 9.5 Median 0.7 8.7 13.2 Mean 1.0 8.6 14.3 Max 1.6 13.0 24.1
11
Date Target Buyer Deal value in €m EBIT multiple Nov 2016 TriStone Flowtech Group Anhui Zhongding Sealing Parts Co Ltd. 170 n/a Jul 2016 FTE automotive GmbH Valeo S.A. 819 n/a Jul 2016 AMK Holding GmbH & Co. KG Zhongding Holding Europe GmbH 130 13.6 Jun 2016 FTE automotive GmbH Valeo S.A. 819 n/a May 2016 HAY Holding GmbH Musashi Seimitsu Industry Co., Ltd. 361 11.3 Apr 2016 Vibracoustic GmbH (50% Stake) Freudenberg SE 740 11.1 Feb 2016 TechniSat Automotive Ningbo Joyson Electronic Preh Holding GmbH 218 13.2 Jan 2016 GETRAG GmbH & Cie KG Magna International Inc. 2,450 n/a
companies from Germany (01.01.2016- today): 13.2x
companies from Europe (Germany excluded) (01.01.2016- today): 13.2x
magazine
Source: MergerMarkets, own calculations, Finance Magazin
Sector Stock market Large-cap Mid-cap Small-cap EBIT multiple EBIT multiple EBIT multiple EBIT multiple multiple from to from to from to Automotive and components 9.9 7.6 10 6.7 8.7 6.4 8.5
12
total increase of 39% for the global production
Sources: PwC 13
55 56 58 63 65 69 66 58 72 75 80 84 86 88 92 95 99 105 107 110 111
0,1 0,2 0,3 20 40 60 80 100 120
2002 2003 2004 2005 2006 2007 2008 2009 2010 2011 2012 2013 2014 2015 2016 2017 2018 2019 2020 2021 2022 Assembly Volumes (millions) Global Light Vehicles Assembly Outlook CAGR in %
14
21,3 22,6 29,0 33,2 36,1 57,5 58,5 78,9 101,5 419,9 Slowakei Hungary Poland Sweden Czech Republic Spain Italy United Kingdom France Germany 685 746 1.072 1.125 1.361 1.600 2.041 2.253 2.754 2.834 Portugal Netherlands Sweden Czech Republic Poland Spain France Italy United Kingdom Germany < 25 75 – 25.0 >75 N/A Revenues in €bn
Source: Statistisches Amt der Europäischen Union (Eurostat)
15
Production of vehicles and engines 319 €bn Production of vehicle body, construction body and trailers 11 €bn Production of spare pars and car accessories 77 €bn 334 266 319 355 360 364 371 407 770 730 720 744 761 773 797 813 100 200 300 400 500 600 650 700 750 800 850 2008 2009 2010 2011 2012 2013 2014 2015 Revenue €bn Employees Revenue Employee 18-113 €bn No data 0-1.2 €bn 1.2 – 18 €bn
Source: Statista; Statistisches Bundesamt
16
Audi 1 BMW 2 Ford 3 Iveco 4 MAN 5 Mercedes 6 Neoplan 7 Opel 8 Porsche 9 Volkswagen 10 Bosch
1
Continental
2
ZF Friedrichshafen
3
Thyssen Krupp
4
BASF SE
5
Mahle
6
Schaeffler
7
Benteler Automobiltechnik
8
Hella KGaA
9
Brose Fahrzeugtechnik
10
Draexlmaier
11
Eberspaecher Holding
12
Getrag
13
Leoni
14
KSPG
15
Freudenberg
16
Websato SE
17
Infineon
18
Leoplold Kostal
19
Trellborg Vibracoustic
20
Kautex Textron
21
1 2 3 4 5 6 6 6 6 6 6 6 6 7 8 9 6 6 3 9 10 10 10 2 10 6 6 8 5 10 10 10 7 2 1 2 5 8 6 8 6
1 12 6 10 3 5 16 14 4 19 8 9 2 10 7 11 20 21 17 18 13
A list of OEM’s and suppliers (only German headquarters):
Source: Germany Trade and Invest Gesellschaft für Außenwirtschaft und Standortmarketing mbH
Rank Europe in 2015 Rank Global in 2015 Company CEO Total Europe OEM automotive parts sales (in $m) in 2015 Total Europe OEM automotive parts sales (in $m) in 2014 Rank Europe in 2014 Rank Global in 2014 1 1 Robert Bosch GmbH Volkmar Denner 21,068 22,120 1 1 2 4 Continental AG Elmar Degenhart 15,425 16,311 2 3 3 5 ZF Friedrichshafen AG Stefan Sommer 13,873 12,428 5 9 4 8 Faurecia Yann Delabriere 12,402 14,024 4 7 5 3 Magna International Inc. Donald Walker 10,604 14,167 3 2 6 11 Valeo SA Jacques Aschenbroich 7,883 8,270 7 11 7 9 Johnson Controls Inc. Alex Molinaroli 7,828 8,596 6 8 8 10 Lear Corp. Matthew Simoncini 6,738 7,091 9 10 9 17 Mahle GmbH Wolf-Henning Scheider 5,896 6,229 11 18 10 19 BASF SE Kurt Bock 5,837 6,901 8 16 11 12 Delphi Automotive Kevin Clark 5,275 6,081 12 13 12 27 Gestamp Automocion SA Francisco Riberas 5,166 5,234 14 28 13 30 Magneti Marelli S.p.A. Petro Gorlier 5,056 5,372 13 30 14 22 Schaeffler AG Klaus Rosenfeld 4,995 4,312 15 23 15 2 Denso Corp. Nobuaki Katoh 4,700 4,036 16 4 16 16 Thyssenkrupp AG Heinrich Hiesinger 4,444 3,467
17 32 HELLA KGaA Hueck & Co. Rolf Breidenbach 3,812 3,657 19 35 18 34 Brose Fahrzeugteile GmbH Juergen Otto 3,493 3,738 17 36 19 31 Samvardhana Motherson Group Vivek Chaand Sehgal 3,318 3,312 24 41 20 49 Eberspaecher Gruppe GmbH Heinrich Baumann 3,167 3,128 21 52 21 28 BorgWarner Inc. James Verier 3,049 3,737 18 29 22 37 Plastic Omnium Co. Laurent Burelle 3,043 2,631 20 40 23 6 Hyundai Mobis Young Deuk Lim 2,920 2,886 23 6 24 25 Autoliv Inc. John Carlson 2,843 3,049 22 22 25 47 Federal-Mogul Corp. Rainer Jueckstock 2,485 2,122 34 57
Top 25 OEM parts suppliers in Europe – Ranked by sales of original equipment parts in 2015
Sources: PwC 17
18
19
Car body Structural parts such as the front pillar, center pillar, rear floor side member and spring house are crucial for safety. Exterior parts like skin & closure parts are visible and therefore require perfect finishes and flawless surface Chassis & Powertrain Engine: electrical engine or combustion engine. Powertrain components: Brakes, exhaust system, transmission Chassis: suspension arms, axles, shock absorbers Electronic Includes: Infotainment systems, chassis electronics (ABS, TCS, EBD, ESP), advanced driver assistance systems (ADAS) and passenger comfort systems Interior Includes: Overhead, door trim, seats, lighting, acoustic insulation as well as cockpits and consoles Exterior Includes: Front and rear bumper, grills, liftgate modules, front end carrier, car mirrors, headlamps and shielding systems
Sources: Clairfield Expert Group
Sources: McKinsey, Strategy Analytics, ZVEI, Roland Berger, PwC and Bain&Company 20
Car body Chassis & Powertrain Exterior Interior Trend autonomous driving car
are used in most cars on the market today
goal of technological development is autonomous driving cars
autonomously driving cars produced will reach 50 million by 2032. Trend big data
a subtopic
big data is becoming more important for new business solutions in the future
data are car-sharing, navigation plugins and telematic services
gradually increasing number of semiconductors year by year
Electronic Major trend is lightweight
components than steel to meet these new regulations. Exemplary components are:
smaller and cheaper cars, as the methods become more established Another trend is electric mobility
mobility, electric drives and battery solutions
in the future
is expected to rise to above 75% by 2030.
without sacrificing durability. At the forefront of this trend is the automotive industry, which is under constant pressure to adhere to increasingly strict fuel economy standards
standards for vehicles are increasingly stringent, automobile manufacturers have been forced to continually find new ways to increase fuel economy
mileage, and the most popular method of reducing vehicle weight has been replacing steel parts with aluminium. Over time, aluminium has been progressively incorporated into automotive doors, trunks, hoods, and engines
automobiles and what is expected to be aluminium-based by 2025
continue throughout the industry. Aluminium is lighter, more energy efficient to process, and has comparable pound-for-pound durability to steel. Steel’s heavy nature has become a burden on fuel efficiency. While aluminium has been identified as the most effective material for light weighting, its use often involves a trade-off of strength for weight when compared to steel
is not correct. Aluminium could nowadays be made as structurally strong as steel by heat-treating
Automotive 25% Construction 24% Electric application 14% Machinery and Equipment 10% Foil Stock 8% Packaging 8% Other 6% Consumer Durables 5%
Sources: Clairfield Expert Group, Alcoa 21
Audi
a new aluminium die casting foundry at Münchsmünster, around 30 km outside of its main plant Ingolstadt in Bavaria, Germany BMW expanded its aluminium foundry capacity in Germany by around 50% General Motors announced the closure of an iron cast foundry and the expansion of an aluminium foundry Ford replaced the steel in its popular F-series truck with aluminium in order to reduce weight and enhance fuel efficiency. Changing the body from steel to aluminium is expected to cut the weight of the car by approx. 700 pounds, or 15 percent of current vehicle weight, which would increase fuel efficiency by as much as 25 percent
include a higher share of lightweight materials e.g. carbon fibers, polymer/ composites, magnesium, aluminium and thin high-tensile steel grades. Aluminium is becoming the most important material in lightweight vehicles by 2035
Sources: Clairfield Expert Group, IKB
20 40 60 80 100 1975 2015 2035 Steel, conventional Steel, High-tensile Aluminium/ Magnesium Polymer/ Composities
Market share in %
China 43% India 8% Russia 7% USA 3% Australia 3% Brazil 3% Canada 2% Norway 2% UAE 2% Others 2%
22
23
The most important and most challenging project for all vehicle producers and the tech industry, Silicon Valley, is autonomous driving. It is a key technology for the future. For example, the Germans show a high demand in the trend of autonomous driving. 51% of the people between 18 and 34 years wish an autonomous parking space search and 34% self parking cars. The development began with drive-assistants like parking assist and adaptive cruise control which are the standard in todays premium cars. The ADAS and AD component market is expected to grow by approx. 16% p.a. until 2025 and to reach a global volume of almost €30bn. The trend of increasing drive assistants will lead the way to autonomous driving, the next revolutionary step. All vehicle producers are working on this revolutionary step. The development of this feature is a key technology for all producers to show their technological leadership. For commercial vehicles, there is a similar big project which goes in the same direction as autonomous driving, the European Truck Platooning Challenge. Building a platform that allows trucks to drive in a platoon at the same speed and same distance. The trucks drive more efficiently due to aerodynamic formation, a linked acceleration and deceleration.
The ADAS and AD component market for light vehicles
1,9 3,4 5,1 7,2 10,2 15,3 1,4 1,9 2,5 3 3,5 3,9 1,4 1,8 2,3 2,8 3,3 3,8 0,5 0,7 0,9 1,3 1,9 2,6 0,7 1,1 1,2 0,2 0,7 5 10 15 20 25 30 2015 2017 2019 2021 2023 2025 Lane depart. warning Night vision Dowsiness detection Parking assist Blind sport detection Adaptive cruise control/ traiffic jam pilot/highway pilot 18% 10.8% 10.5% 23% 16.3% CAGR 2015-2025 13.9% 6.6%
Sources: Roland Berger
Big data, as part of the digitalization, transforms cars into digital data storages by collecting and saving all information around them. As part of the global trend of digitalization, cars have been transformed into digital data banks, collecting and saving all information around them and producing big data. The mean of installed semiconductors in cars has increased over time, thus cars are able to collect more information today. Vehicle producers want to use this information storage to identify and provide new services for
connected to the central information database. Car drivers benefit from this information by receiving a warning of traffic jams or arriving ambulances to accidents. More useful information for drivers can be the weather conditions; the system is able to notify the driver of fog or icy roads.
The drivers will arrive safely and on time to their appointments. This service could be a navigation plugin.
developed an app to locate available parking lots; the app directs the driver to a lot and the allows in app payment through Visa.
Sources: WIrtschaftsWoche
250 300 350 400 2008 2010 2012 2014 2016
24
2.750 4.000 720 1.200 30 1.400 600 2015 Projection: 2030 Sale of cars Accesoires Carsharing Big data business models
To fulfil the environmental regulations in the future, e-mobility is the main solution to achieve these goals. The EU emission goal for 2015 was 130g CO2/Km and the next goal will be 95g CO2/Km by 2020. USA set a goal of 93g CO2/Km by 2025. The climate resolution from Paris forces governments to enhance this development globally. PwC expects the number of hybrid- and electric vehicles in the three major global markets EU, NAFTA and China for new registered cars to be more than 75% by 2030. The share of electric cars is 3% in the three major global markets at the moment. Non-commercial vehicles: Improvement of the combustion engine is the short-term plan for the future, the long-term plan is to build electrically-powered vehicles. The big OEM’s want to sell 2-3 million cars in 2025. Hybrid-cars are the start of electrification and the goal is a full-electric car in the future. The current battery is the bottleneck of technological development. Technological leaders in manufacturing batteries are Asian companies at the moment. R&D investments in this technique are increasing from year to year. The overall market value is €325bn to €500bn for new efficient drive systems. Commercial vehicles: The short-term and mid-term plan for producers of trucks is to improve the combustion engines. The weight of the batteries would reduce the capacity
lasting to allow them to continue to provide just in time supply services. That said, 70% of all industry CEOs still believe that 1/3 of all light trucks will be completely electric by
Development Global powertrain production [m units] Global xEV production [m units]
25
85,7 92,4 94 2,1 6,2 24,9 87,8 98,6 118,9
20 40 60 80 100 120 140
2015 2020 2025
xEVs ICE
<1% 3% CAGR 2015-2025 28%
1) Including mild hybrid vehicles (up to 20 kW) and ICE start-stop
39% 28% CAGR 2015-2025 33% 24% 1,6 4 13,2
0,3 1,2 7 0,3 0,9 4,6
2,1 6,2 24,9
5 10 15 20 25 30
2015 2020 2025
EV PHEV Full Hybrid
Sources: Roland Berger
26
Market development of powertrain components for light vehicles €bn
100 107 114 117 116 113 71 73 76 75 76 73 39 41 44 45 45 46 7 14 19 28 38 47
50 100 150 200 250 300
2015 2017 2019 2021 2023 2025 xEV Exhaust Transmission/ Drivetrain Engine 20.4% 0.3% 1.6% 1.3% 2.5% CAGR 2015-2025
Sources: Roland Berger
27
more than 8.000 people in 45 locations around the globe
Revenue (2015): €1,507.3m EBITDA (2015): €222.8m EBIT (2015): €135.2m
shielding technology 27%, housing modules 21%, specialty gaskets 17%, cylinder head gaskets 14%, aftermarket 9%, engineered plastics 6%, exhaust gas purification 3%, e-mobility 1%. ElringKlinger is market leader in cylinder head gaskets.
three main markets: NAFTA, China and Europe. The unexpected leader was the European market, driven by low fuel prices, high employment rate and low interest rates. Since the financial crisis in 2008/09 the market has
increased by 14.3% during the first six months of 2016.
Germany and 53% of its production subsidiary Powertrain Products GmbH. Hofer is a specialist in battery- and fuel cell technology as well as for
Elring Klinger strengthens its position in the field of electric mobility with this
megatrend in the sector. There are various concepts to achieve this goal. One is green technology, which is not only the reduction of CO2 but also the reduction of nitrogen oxides, hydrocarbons and soot particles are also
end-to-end exhaust gas purification systems. ElringKlinger is one of a few companies, that is able to produce these high-tech components. Lightweight design with new components is another way to reduce fuel consumption and emissions. E-mobility and fuel-cells are concepts as well; these concepts aim to replace the complete combustion engine. This radical step will come; in small ones, but the steps go in this direction. The acquisition of Hofer AG enhances the know-how in electric mobility. The strategy is to stay a technological leader
3.7% to €33.4m in 2016
megatrends: Efficient drive systems. Main projects are the improvement of components for the car body in lightweight production. They used new materials like composites. Another project is an emission control concept for common rail engines
vehicles. The e-mobility division concentrates on a concept of lithium ion accumulator modules. Applications for this niche concept could be, forklift trucks and construction machinery.
the key trends of lightweight and electro mobility, is the best way to remain the leader as a supplier in the sector. Acquisitions of companies is a way to gain know-how in the key trends.
Sources: ElringKlinger
28
Lightweight Electric mobility Autonomous driving Big data Automotive OEM’s and suppliers need qualified employees and extensive knowledge of production in these technological trends M&A Strategy
production sites
know how and a manufacturing sites for production
venture
need some time
know how and employees in the needed technology
mobility to gain technological know-how and employees Investments in R&D and production Joint venture M&A is the most suitable way to gain access to both, technological know-how and employees
Sources: Clairfield Expert Group
29
20 offices Strong presence in Europe with 20 offices 14 countries Active in all relevant European markets #14 Ranked in top 15 in Europe
Clairfield in Europe
Frankfurt Düsseldorf Stuttgart Strong presence all over Germany, covering all major industries supported by:
Clairfield in Germany
Senior partners Years in M&A Industry focus Dirk Freiland 17 TMT, automotive & machinery, services Jack Helm 30 health care, industry, automatization Darius Kianzad 20 clean tech, health care, resources
30 industry, healthcare, retail Martin Lemmer 13 food and beverage, business services Dirk Middelhoff 10 TMT , high-tech Andreas Piechotta 16 industry, medical technology
19 consumer goods, industry, logistic,retail
26 financial service, consumer goods
League table Germany 2016 (Thomson Reuters)
Rank Firm # of Deals #1 EY 53 #2 KPMG 47 #3 Concentro Management AG 29 #4 PwC 22 #5 Rothschild 21 #6 Altium Capital Limited 20 #6 ACXIT Capital Partners 20 #8 Lincoln International 19 #9 Baker Tilly International 16 #9 M&A International 16 #11 IMAP 14 #11 Globalscope 14 #13 Deutsche Bank 12 #14 perspektiv GmbH 11 #14 Clairfield International 11 30
480+ Professionals in global offices 110 M&A transactions closed in 2016 (small and medium cap) Over 600 transactions in the last 5 years Approximately 75 in the automotive industry €2.8 bn Cumulative value of transactions closed in 2016
Clairfield Worldwide League table Europe 2016 (Thomson Reuters)
Rank Firm # of Deals #1 PwC 321 #2 KPMG 289 #3 Rothschild 242 #4 EY 234 #5 Deloitte 177 #6 BDO 170 #7 IMAP 136 #8 M&A International 134 #9 Lazard 112 #10 BNP Paribas SA 87 #11 Clairfield International 82 #12 Citi 78 #13 Morgan Stanley 72 #14 CFI 70 #15 Baker Tilly International 68 Europe Austria Vienna Belgium Antwerp Brussels Denmark Copenhagen Finland Helsinki France Lyon Marseille Nantes Paris Germany Dusseldorf Frankfurt Stuttgart Hungary Budapest Italy Milan Netherlands Amsterdam Norway Oslo Poland Warsaw Russia Moscow Spain Barcelona Madrid Valencia Sweden Stockholm Switzerland Geneva UK Birmingham London North America USA Atlanta Miami Minneapolis New York Phoenix Seattle Washington, D.C. Latin America Brazil Curitiba Sao Paulo Chile Santiago de Chile Mexico Mexico City Asia-Pacific Australia Brisbane China Hong Kong India Mumbai 31
32
Sector Experts
and networks
experts
Cross border and internationality
in more than 40 countries in local language Business development power
targeting and sell side buyers access
involvement
companies Senior Attention
level with high level of discretion Private Equity
market players
Outbound M&A Special Situations
Capital Markets Advisory
Inbound M&A Domestic M&A Expansion M&A
33
Mergers & Acquisitions
acquisition opportunities
Disposals/ Divestitures
Capital solutions
recaps
and placings
Advisory
ventures
Restructuring advisory
Sector expertise The longstanding experiences of our partners in diverse industries combined with our outstandingly connected industry experts enable our clients to identify new strategic possibilities Confidentiality Trust and integrity are essential values for our advisory services. Information is treated with the highest discretion Seniority of the team Senior involvement throughout all phases of a transaction is the single most important hallmark of our execution style and commitment to quality and prudent advice Independence We own our business and act as entrepreneurs free of conflicts usually found in large multi-product firms Mid-Market Clairfield is one of the leading global M&A firms typically executing mid-sized transactions up to an enterprise value of 500 m€ Cross-border With partner offices in 50% of all OECD countries, Clairfield International covers 75% of Germany’s most significant trade partners Long-term relationships Our advice is embedded in long term relationships with corporates, family offices and private equity investors
Sector Sub-Sectors Representative Clients Industrials
Consumer Goods, Food & Retail
Business Services
Natural Resources, Cleantech & Energy
Technology, Media & Telecoms
Traditional Media
Software & Equipment
Healthcare & Life Sciences
Equipment
Financial Institutions & Private Equity
34
35
Poland/ Germany Buy
Advisor to the seller October 2016
E-commerce, spare car parts was sold France/Brazil Buy
Advisor to the buyer December 2015
Calibration services acquired Germany Buy
Advisor to the buyer April 2015
High-performance metals acquired France/The Netherlands Buy
Advisor to buyer February 2015
Engineering consulting acquired Germany Sell
Advisor to the buyer April 2015
Machining compressor wheels acquired France Buy
Advisor to the buyer July 2014
Leaf springs, stabilizer bars for heavy trucks acquired Italy/ Germany Sell
Advisor to the buyer June 2014
Lightweight technologies acquired Italy/ Germany Sell
Advisor to buyer February 2014
Varnish and coatings acquired
backed by
36
Finland Sell
Advisor to the seller April 2016
Auto body repair was sold to Germany/France Sell
Advisor to the seller May 2015
Car sharing was sold to Finland/Poland Sell
Advisor to the seller February 2015
Automotive parts acquired Finland/Norway Buy
Advisor to buyer January 2015
Automotive IT acquired China/Germany
Advisor to WeiChai April 2014
Automotive parts established a production cooperation for China with Italy Sell
Advisor to the seller July 2013
Automotive parts sold autoneum Italy to India Buy
Advisor to the buyer January 2012
Components acquired Germany Sell
Advisor to the seller April 2010
Automotive plastic parts acquired
37
Clairfield International in Italy and Germany advised IMR Client Client nationality Counterparty Counterparty nationality Transaction type Sector Transaction team IMR Automotive Italy FPK Lightweight Technologies GmbH Germany Acquisition Automotive Filippo Guicciardi (Lead) Dirk F. Freiland
Clairfield International advised the Italian IMR Automotive S.p.A. in the acquisition of the German FPK Lightweight Technologies Deutschland GmbH. After the transaction, with an enterprise value in the range of €22 million, the Italian group expects to reach a consolidated turnover in the range of €200 million in 2014.
The acquired business is a company active in the design and manufacture of composite lightweight structures and aerodynamic components for the automotive sector, with 2013 sales in the range of €22 million. IMR is a world-class supplier in the manufacturing of exterior parts for the automotive and truck industry. IMR offers Tier 1 services and products to the most prestigious car manufacturers in the world, employing approximately 1,300 workers in five different plants, three located in Northern Italy, one in Spain and one in Germany, with 2013 sales in the range of €135 million and an EBITBA margin of about 10%. We are very satisfied to have acquired FPK, following the recent acquisition of Sommer Industrielackierung, which will allow us to cover the German market more efficiently and to broaden our services. We are considering a further acquisition in Europe with the assistance of our advisors at Clairfield International. Matteo Galmarini, shareholder and CFO of IMR Automotive
38
sold
to
Clairfield International in Italy advised Autoneum Client Client nationality Counterparty Counterparty nationality Transaction type Sector Transaction team Autoneum Swiss Mutares AG Germany Sale Automotive Filippo Guicciardi (Lead) Andrea Scarsi Dirk Freiland
The listed Swiss automotive-parts group Autoneum Holding AG sold 100% of its Italian subsidiary automotive manufacturer Autoneum Italy Spa to mutares AG, the listed Munich- based investment company.
Autoneum Group is a leading player in the industry of acoustic and thermal management solutions for motor vehicles. The Group is a partner for major light vehicle and heavy truck manufacturers around the world. The historical Italian nucleus of Autoneum Italy SpA was incorporated in the 1930s. Today the company, headquartered in Turin, is the result of the acquisition of Fimit by Autoneum Group in 1996, at that time called Rieter Automotive Systems. Autoneum Italy produces interior components for acoustic and thermal isolation for both cars and trucks. The turnover in 2012 was approximately €110 million. Mutares was established in 2008 as an operational industrial group focusing on the acquisition of non-core businesses that are being sold by large international
approximately €500 million).
39
Germany Buy
Advisor to the buyer 2015
acquired Germany Buy
Advisor to the buyer 2015
acquired Germany Buy
Advisor to the buyer 2015
Germany Buy
Advisor to the buyer 2015
acquired Germany Sell
Advisor to the seller 2011
acquired a 40% interest in Germany Sell
Advisor to the seller 2006
acquired
Lindsay Goldberg, a leading global private equity fund and manager
its
funds with a volume of more than $10 billion, acquired VDM Metals GmbH from
GmbH produces high- performance materials with applications in the aerospace, chemical, oil and gas, energy, automotive, electronics, and electrical engineering industries. 3i Group acquired Weener Plastic Packaging Group (WPPG). The U.K.-listed firm bought the business from German private equity firm Lindsay Goldberg Vogel. WPPG designs, develops and manufactures added value caps, closures, roll-on balls, jars and bottles for the personal care, food and beverage, and home care market. The midmarket private equity investor Equistone Partners Europe acquired Unlimited Footwear Group together with management. Equistone is one of Europe‘s leading private equity investors and invests especially in established medium-sized companies with a good market position,
potential for growth and a sustainable positive development
earnings. Vedior N.V. sold ISU Personaldienstleistungen GmbH, a temporary staffing company, to BayernLB Private Equity. Bayern LB Private Equity is the fully-
PE subsidiary
Bayerische Landesbank Girozentrale with a total balance sheet of 340 billion euros and 9500 employees.
together with management acquired 100 % of shares from Unlimited Footwear Group
German SME investor Halder acquired PRAE-TURBO Group through a management buy-
machining compressor wheels for automotive
includes a long-term unit range as well as a revolving credit facility. The new financing structure guarantees financial flexibility to the company and also supports the projected growth. CemeCon AG is a specialist in state-of-the-art coating solutions for cutting tools and components. The Company is located at Würselen (close to Aachen) where it operates one of the largest coating service centers in Europe. In 2008 CemeCon reported sales of €48 million.
40
Germany/ France Buy
Advisor to the buyer 2014
acquired Germany Buy
Advisor to the buyer 2013
acquired Germany Buy
Advisor to the buyer 2013
acquired Germany/ US Buy
Advisor to the buyer 2012
acquired Germany Buy
Advisor to the buyer 2011
acquired Germany Buy
Advisor to the buyer 2010
acquired
Henkel, a global leader in brands and technologies in three business areas: Laundry & Home Care, Beauty Care and Adhesive Technologies, acquired The Bergquist Company, the leading global developer and manufacturer
thermal management materials and substrates for electronic systems. Medort Group, a Polish
acquired Meyra Ortopedia,
producers and distributors of wheelchairs and
devices, which employs around 440 people. The acquisition is confirmed as an asset deal, with the buyer taking over all assets of Meyra including buildings and machinery production. Michelman is a global developer and producer of water-based coatings, surface modifiers, emulsion dispersions and powders. Michelman serves multinational and also regional customers. They acquired the Ecronova Polymer GmbH, which has more than 35 years
experience in the development, production, and commercialization
water based polymers. Bilfinger SE is one of the market leaders in the segments
energy technology, nuclear & environmental technologies, piping technology, machinery & apparatus engineering, and power plants. Bilfinger acquired the control systems specialist Helmut Mauell GmbH, a leading provider of technical process systems and equipment for modern power plants. DESIGNA Verkehrsleittechnik GmbH develops, produces, installs, and maintains fully automatic parking management systems. Asytec GmbH is active in the development, installation and maintenance
customized ticket, access control, and video systems. A prominent local customer is Frankfurt Airport, who runs its entire car parking system by Asytec. GFT Group, headquartered in Germany, is an international provider
innovative IT solutions and services. GFT is among the world's leading IT service providers in the financial services sector. With Asymo, GFT strengthens its expertise in bank process consulting and supports its international growth strategy.
41
founders of with support from Australia Sell
Advisor to the seller October 2015
Provider of design consulting acquired United Kingdom Sell
Advisor to the seller June 2015
Insurance and risk management consulting acquired Norway Sell
Advisor to the seller April 2015
Consulting company for CRM solutions acquired France/ Belgium Buy
Advisor to the buyer April 2015
Strategy and operational excellence consulting acquired Denmark Sell
Advisor to the seller April 2014
Consulting services to the aviation industry acquired France LBO
Advisor to the buyer September 2013
Management consulting acquired the company from India Strategic equity partnership
Advisor to KPIT Mach 2012
IT consulting strategic partnership with Australia Sell
Advisor to the seller November 2011
Infrastructure design solutions acquired
42
Management bought own shares back Federal Insulation of Indiana, Inc. United Kingdom Buy
Advisor to the buyer June 215
Instrumentation manufacturer acquired Finland Sell
Advisor to the seller June 2015
Wearable technology acquired Finland/ Poland Buy
Advisor to the buyer February 2015
Wiring systems and electronics acquired France Sell
Advisor to the seller February 2015
Calibration service acquired Italy Sell
Advisor to the seller April 2014
Wholesale distribution of electric materials acquired United Kingdom Buy
Advisor to the buyer February 2014
Building measurement and control peripherals United States Buy
Advisor to the buyer February 2014
Electrical insulation materials acquired Germany Buy
Advisor to the buyer January 2010
Systems for parking space management acquired
43
acquired all activities related to production on injection-stretch- blow molding equipment of acquired all activities related to production of extrusion blow moulding machines (HDPE) of United Kingdom Sell
Advisor to the seller January 2016
Smart batteries acquired The Netherlands Buy
Advisor to the buyer October 2015
Hydraulic components acquired France Buy
Advisor to the buyer July 2015
Production and distribution of bearings acquired Italy Sell
Advisor to the seller December 2014
Extrusion and injection blow moulding machines Italy Sell
Advisor to the seller December 2014
Extrusion and injection blow moulding machines Italy Sell
Advisor to the seller December 2014
Extrusion and injection blow moulding machines acquired The Netherlands Buy
Advisor to the buyer August 2014
Technical and industrial automation acquired United Kingdom Sell
Advisor to the seller July 2014
High voltage coils acquired
44
France/ Italy Buy
Advisor to the buyer January 2016
Personal protective equipment acquired United States Buy
Advisor to the buyer August 2015
Lighting and equipment acquired Sweden Merger
Advisor to Hamilton People May 2015
Staffing and recruitment merged with The Netherlands Sell
Advisor to the seller April 2015
Processing of business documents acquired France Sell
Advisor to the seller June 2014
Services for hydroelectrics acquired Spain Sell
Advisor to the seller November 2013
Industrial laundry acquired United States Sell
Advisor to the seller April 2013
Contract and concessions catering acquired Finland Sell
Advisor to the seller May 2012
Outsourced payroll services acquired
45
United States Sell
Advisor to the seller November 2015
Wireless connection hardware acquired France/ the Netherlands Buy
Advisor to the buyer October 2015
R&D and high technology services acquired Finland Buy
Advisor to the buyer January 2015
Software and hardware solutions acquired Germany Buy
Advisor to the buyer October 2014
Thermal management products acquired Finland Sell
Advisor to the seller April 2014
System provider to supply and maintain ICT systems acquired The Netherlands Buy
Advisor to the buyer November 2013
IT staffing agency acquired Germany Sell
Advisor to the seller September 2013
Data collection and analysis provider acquired India Sell
Advisor to the seller September 2013
Technology consulting & product engineering service acquired
46
47
large cap clients, whether assisting with a suitable growth strategy or going through the process of selling a business.
caused by several drivers and trends, but also by political and legal requirements. They impact the direction of change and also the direction of innovations. With our sector experts located all around the world, Clairfield International understands this complicated sector and is perfectly positioned to help clients take advantage of market conditions.
still very attractive for international M&A and Clairfield International has closed many successful transactions in this sector. Clairfield International understands the different players in the market and the importance of suppliers for the automotive industry. Our clients consist of:
Our automotive sector experts have analysed following trends for the market:
engines while improving power and fuel consumption, improved aerodynamics
lights or autonomous driving are more demanded than comfort features
connectivity: infotainment and connectivity systems are nowadays standardized equipment in premium cars
products or services for increasing customer needs have an important role in the market
but battery electric cars, especially in the premium sector are catching up Next to the trends caused by the market, there are also political and natural trends:
face
Dirk Freiland is managing partner at Clairfield International and head of the automotive sector team.
Europe North and Latin America Australasia Offices: Brazil Mexico USA Offices: Australia China
Countries where Clairfield International is active Countries where Clairfield International is active & has automotive experts
Offices: Belgium Denmark Finland France Germany Italy The Netherlands Norway Poland Russia (Moskva) Spain Sweden UK
automotive key markets with an outlook by the responsible Clairfield expert
48
more than $100 billion per year in revenues.
period of the previous year, reaching a total of 1.7 million vehicles produced. Exports,
increase of almost 20%.
Volkswagen and Ford) strongly fell with the credit crisis in Brazil. Its share dropped down from 82% to 58% in ten years.
will gain space. From this change, the national market is expected to reach 5 million vehicles in the next decade, with an average expansion of 5.6% per year from 2017.
fragmented market and it has showed resilience in moment of crisis. PE funds have already invested in auto parts distribution.
aftermarket industry for the next years.
Claudio Doerzbacher – Partner
Brazilian automotive sector is focusing on restructuring and investments in production plants to face crisis Market overview Trends
OEM’s Auto part suppliers
Before founding Redirection in 2007, he was manager of M&A projects for three years in the IGC Partners. He worked for three years as CEO of Axion Group, being responsible for directing the
company in the auto-parts industry with factory in Brazil and China. He has extensive experience in M&A and the auto-parts aftermarket industry.
49
vehicles), which represented uninterrupted growth since 2009. In Western Europe, production progressed by 7% in 2015.
French manufacturers to add substantial volume. In 2015, French manufacturers produced 6m vehicles worldwide (up 5.9% compared to 2014) among which 78% were sold outside France (or 4.7m vehicles).
still ranks 2nd) and Renault’s sales increased by 3.3% thanks to European market sales growth. French manufacturers employed 311, 000 people worldwide.
Union since the financial downturn.
future for transportation as disruptive players are competing with historical auto makers.
through their innovative technologies involving both assisted driving and global connectivity.
stricter in the years to come, particularly in mature markets.
CICE or CIR, should continue to positively impact the industry as it contributes to narrow the labor cost gap between French auto makers and their peers.
Bertrand Hermez – Partner
Mobility services and car-sharing solutions are major trends in the French automotive industry Market overview Trends
OEM’s Auto part suppliers
Bertrand Hermez has more than 23 years of M&A and investment banking services experience. He began his career as an Associate at Credit National (Natixis) in charge of structured finance (first in Luxembourg, and then in Paris). Prior to joining Clairfield International, Bertrand was a Managing Director - Corporate Finance at Quilvest Bank in Paris. Previously, he was a Director at Deloitte where he led the French TMT Corporate Finance practice and before that worked at Apax Partners in charge of cross-border deals and fundraising assignments. Bertrand graduated from EM Lyon (major in Finance) and also has a degree from the Institute of Chartered Accountants (England & Wales)
50
Dirk Freiland – Managing Partner
€404 billion and they remain 21st of the world’s 100 top automotive suppliers.
buses in 2015, Germany remains the leader in car production in Europe and the export leader in the world, ahead of Japan and South Korea.
produced passenger vehicle were exported. Germany is aware of the chances which arise from emerging markets like China, Brazil or India.
and innovative capacity, an essential advantage in order to defend their position in a fast-changing market.
data business models to make a revenue of $600 billion in 2030
argument in the future
The automotive sector has a 20% share of total sales generated by the general industry in Germany Market overview Trends
Dirk Freiland has twelve years of experience in M&A and corporate
sized M&A company in southern Germany. Thanks to his in-depth knowledge of this sector and good connections, Mr. Freiland has successfully advised several automotive transactions in Germany in the last few years. He is head of the automotive sector team and responsible for Germany, Austria and CH.
OEM’s Auto part suppliers
51
and the fifth in Europe. In fact, the Italian automotive industry sold approximately 1,574.872 cars compared to the 200,000 sold in 2014.
years of negative results.
(+ 16.6%), diesel (+ 24.8%), hybrid (+ 21.5%) and electrical (+ 31.5%). The gas cars, instead, registered a slow decrease: - 3% Gpl and – 13% methane vehicles.
Filippo Guicciardi – Partner
Production capabilities and sales have increased in 2014 after years of negative results Market overview Recent transactions
Filippo Guicciardi, after gaining experience in a first-rate multinational auditing company, worked for a Milan consulting company that had a strong orientation towards SMEs. In 1999 he co-founded K Finance, an advisory company specialized in domestic and cross-border merger & acquisition deals, gaining a deep knowledge
M&A processes in industries like textile, pharmaceutical, mechanical engineering, logistic and machine
Equity industry, working with all the main players in the Italian market.
OEM’s Auto part suppliers
52
largest exporter of vehicles in the world
employing roughly 675,000 people in Mexico (accounting for 40% of all automobile sector jobs in North America)
foreign direct investment
exported, Mexico is the 4th largest exporter, just behind Germany, Japan and South Korea
toppling Japan
and industry wages in the country can be as low as $3.77, while wages in the U.S. and Canada average between $40 and $60 an hour
companies to easily export their products duty-free and has access to over 60% of the world’s GDP because of their relationships through these agreements
location for expanding automobile sales into new markets such as Latin America, while at the same time feeding the world’s largest market – the U.S.
economic expansion; it is altering the composition of Mexico’s society by contributing to the rapid growth of the middle class. 53.2% of Mexicans are considered to be in the middle class today.
Pablo Coballasi – Managing Partner
Mexico is becoming an important global hub for the automotive industry, caused by a major privatization wave Market Overview Trends
OEM’s Auto part suppliers
Over the last 20 years Pablo Coballasi has worked as a private equity investor, investment banker, and consultant in the United States and Latin America. For the last eight years, Mr. Coballasi helped build Clairfield Mexico into one of Mexico’s leading middle- market investment banking practices. Mr. Coballasi holds a BE in Mechanical Engineering from Vanderbilt University and an MBA from Northwestern’s Kellogg School of Management.
53
Tadeusz Madej – Partner
reaching a total value of €26bn. The sector’s share in total industry production was 9.5%, making it the second biggest industry in Poland. Sector’s profitability amounted to 5.2%.
CAGR of commercial vehicles production between 2009 and 2013 amounted to 11,9% making it one of the key drivers for automotive sector growth in Poland.
A second large part of the sector are foreign OEMs’ facilities. In turn, Polish OEM’s consist mainly of bus manufacturers (e.g. Solaris, Solbus) and truck manufacturers (e.g. Honker, Jelcz).
production was exported, mainly to customers from Germany.
mainly on the production for foreign OEM’s, global technology trends can also be
improvement of engine performance.
few public contracts for purchase of such vehicles.
Polish army.
According to the strong local supplier industry, Poland remains to be an important production location in Europe for foreign OEM’s Market overview Trends
Partner CET Poland. With CET since 1992. Head of Clairfield Poland’s Industrial and Energy practice. Completed over 300 projects including 50 transactions. Clients include the spare part distributors: in Poland like; Inter-Team (JV with Hella), AD Polska sold to AD France, JC Auto floatation on Warsaw Stock Exchange) and others like , PKN Orlen, KGHM, Tauron, Cisco, PERN, PGNiG, PGE, Comcast Corporation, Lockheed Martin, BAE/SAAB. Education Czestochowa Technical University (MSc), Warsaw (Postgraduate Studies in Organisation and Management).
OEM’s Auto part suppliers*
*Some of them already acquired by international groups
54
manufacturer in the Old Continent in commercial and industrial vehicles
Vehicle manufacturing experienced 7.9% of growth through September as 2,220,722 vehicles were manufactured during 2016. In the same period, vehicle exports grew 8.4%. All these positives numbers make reasonable to think that Spain will produce about 2.800.000 cars at the end of the year 2016.
Brian O’Hare – Chairman
The growth in the Spanish auto industry has improved by a vast network of local parts suppliers and relatively flexible labor laws. Market overview Trends
OEM’s Auto part suppliers
Brian O'Hare is founding partner of Clairfield Spain and of the Clairfield partnership. He has advised transactions in real estate, healthcare, business services, financial institutions, and transportation, among other sectors. Mr. O’Hare appears regularly
leading financial periodicals. Mr. O’Hare earned an MBA from IESE, Barcelona, Spain. He is active in the American Society of Barcelona, where he was President from 1995 to 1999, and the American Chamber of Commerce in Spain, where he is currently 1st Vice President.
55
by 1.3% since 2012.
worldwide, 49.2% of these being within the EU.
501,756 in 2013.
Caterham Cars Ltd and McLaren Automotive. The overall output of these three companies is small.
provides employment for more than 700,000 people in the UK.
compared to an average of €26,370 for vehicles exported, meaning that the balance
a value of €58.7 billion, an increase of 39.2% since 2013.
manufacturers commit to providing financial support.
2016 & 2017.
consumers in terms of entertainment, but also for manufacturers who receive revenue opportunities from analysing the data that they will now be able to collect from drivers.
The British automotive industry is expected to grow within the next years, without being outperformed Market overview Trends
OEM’s manufacturing in the UK Auto part suppliers
Chris Gregory – Partner – Chris Gregory has over 25 years of experience in M&A and corporate finance including advising on various automotive transactions in the UK. Chris was previously a Corporate Finance Partner within Deloitte. Chris is the head of the industrial sector team within Clairfield. Simon Lloydbottom – Associate Director – Simon Lloydbottom has six years of experience in M&A and corporate finance including experience advising on various transactions in the UK with a specific focus on industrial transactions.
56
Walter Jackson “Jack” Helm has been advising in cross-border corporate finance and mergers and acquisitions for over thirty years. Educated in both the US and Germany, Mr. Helm was trained at Citibank and Lehman Brothers, New York and relocated to Frankfurt in 1988 to open Lehman Brothers’ new German corporate finance practice. His affinity for life sciences has resulted in significant repeat transactions primarily in the chemicals and healthcare sector and diversified industrial segments, and in 1996 he became Managing Director and Country Head of the merger and acquisitions specialty group Wasserstein Perella. Upon the acquisition of Wasserstein Perella by the Dresdner Bank in 2001, Mr. Helm returned to his native Virginia to pursue venture capital opportunities and returned to the German advisory business in 2011. Mr. Helm has a bachelor’s degree from the University of Virginia and a Master in International Business from Georgetown University. E-mail: helm@de.clairfield.com
Dirk Freiland has twelve years of experience in M&A and corporate finance. Prior to joining Clairfield he was co-founder of a medium sized M&A company in Southern Germany. Previously, he worked as senior manager at Accenture (formerly Andersen Consulting) in Strategy and Change Management where he was responsible for building up the M&A team and activities for Germany, Austria and Switzerland. Further milestones in his career include a small service company he built from 20 to 120 people within 14 months and Alcatal (Paris) where he worked in research and development. Dirk Freiland studied Mechanical Engineering, Electronics and Computer Science of the University of Applied Sciences of Esslingen/Stuttgart and Paris. E-mail: freiland@de.clairfield.com
Darius Kianzad began his career in 1991 at the Treuhandanstalt in Halle and Berlin. Between 1993 and 2005, Mr. Kianzad held leading positions in renowned audit firms and investment banks such as PricewaterhouseCoopers in Frankfurt and was Senior Vice President M&A at Sal. Oppenheim where he was in charge of M&A transactions in the energy and automotive sectors and also became co-leader of the Industrials segment. Between 2006 and 2010, Mr. Kianzad was a member of the Management board at ista Group, a leading international energy services company, in charge of Corporate Development/M&A and Regional Head of „Emerging Markets“. Darius Oliver Kianzad graduated with a master´s degree in Economics (University of Heidelberg) and has completed a General Management program at the University of St. Gallen and the Advanced Management program at INSEAD. E-mail: kianzad@de.clairfield.com
57
Alexander Klemm was born in South Africa, raised in Germany and the UK and studied in the UK, USA and Germany. He has over 30 years investment and wholesale banking transaction experience in M&A and equity capital markets. He worked in Frankfurt, London and New York at Deutsche Bank/Morgan Grenfell, Lehman Brothers, UBS Warburg, JPMorgan Cazenove, and Hauck. He has also held various senior management positions in banking. As head of investment banking at JPMorgan Cazenove in Germany/Austria/Switzerland, he established the Frankfurt office and built Cazenove’s successful midmarket advisory and capital markets
Business School and a Ph.D. in finance from Freie Universität Berlin. E-mail: klemm@de.clairfield.com
Martin Lemmer has extensive experience in strategy consulting and advising corporates and private equity investors in corporate finance matters. Prior to Clairfield International, Martin Lemmer worked for the London based consulting firm L.E.K. Consulting and M&A boutique First Capital Partners. Martin Lemmer has advised a large number of projects both on the buy- and sell-side serving strategic buyers and private equity players. Amongst others, Martin’s business focus lies in the retail, food and beverage, business services and healthcare industries. He graduated in business administration from the University of St. Gallen (Switzerland) and the Richard Ivey School of Business at University of Western Ontario in London (Canada). E-mail: lemmer@de.clairfield.com
Dirk Middelhoff holds a degree in Business Law (LL.B) with a focus on corporate finance and more than 10 years of experience in corporate finance, business development and strategy. Until 2008, Dirk Middelhoff worked for the listed EMC Corporation, headquartered in Boston, one of the 25 largest IT companies in the Fortune 500. There he led national and international projects such as, Vodafone, Deutsche Bank, Metro etc.. At last head of strategic alliances and mergers &
and international companies from technology sectors among others, software, consulting, photonic on the buy or sell side as well as start-ups in the fields of software, internet and media with focus of founding and financing. Numerous publications on topics of accounting, valuation and financing. Dirk Middelhoff is member of various advisory and supervisory boards in technology companies. E-mail: middelhoff@de.clairfield.com
58
Andreas Piechotta has been involved in international equity- and transaction business for almost 16 years. As a partner of a well-known international M&A advisory firm he has been responsible for business development in Eastern Europe and has managed to execute a variety of cross border transactions, e. g. in Poland, Hungary and Slovenia. Andreas Piechotta began his career in 1994 at Pfeifer & Langen, a known family-owned German sugar producer. At Pfeifer & Langen he supported various privatization processes in the Polish sugar industry. From 1997 to 2004 Mr. Piechotta was engaged in the Private Equity activities of DEWB AG, a subsidiary of JENOPTIK Group. Born in Poland, Andreas Piechotta studied Law at the University Bayreuth/Germany being a qualified lawyer, with a particular focus
E-mail: piechotta@de.clairfield.com
Prior to founding M&A advisory firm SynCap in 2000 and contributing it subsequently to Clairfield, Albert worked as Executive Director/ Co-Head Corporate Finance for finance specialist group VMR where he was responsible for international fund raising projects and M&A. He held positions in his prior career at Deutsche Bank (BAI), Milan, KPMG/ Milan and Lehman Brothers/ Frankfurt, where he, among other responsibilities, advised on international and domestic M&A transactions. He studied Law and Economics at the Universities of Passau, Pavia/ Italy and Munich. He is qualified as an attorney-at-law in Germany and earned his Law degree from Ludwig-Maximilian-University of Munich and his PhD from Friedrich-Schiller-University of Jena. E-mail: schander@de.clairfield.com
59
Office Stuttgart Mörikestraße 11 D-70178 Stuttgart Tel.: +49 (711) 620079 - 0 Fax: +49 (711) 620079 – 29 stuttgart@de.clairfield.com Office Frankfurt Friedrich- Ebert- Anlage 18 D-60325 Frankfurt am Main Tel.: +49 (69) 707969-60 Fax: +49 (69) 707969-99 frankfurt@de.clairfield.com Office Düsseldorf
D-40474 Düsseldorf Tel.: + 49 (211) 415546-14 Fax: + 49 (211) 415546-29 duesseldorf@de.clairfield.com
International Offices Europe
Clairfield Austria Vienna Clairfield Belgium Antwerp Brussels Clairfield Denmark Copenhagen Clairfield Finland Helsinki Clairfield France Lyon Marseille Nantes Paris Clairfield Hungary Budapest Clairfield Italy Milan Clairfield Netherlands Amsterdam Clairfield Norway Oslo Clairfield Poland Warsaw Clairfield Russia Moscow Clairfield Spain Barcelona Madrid Valencia Clairfield Sweden Stockholm Clairfield Switzerland Geneva Clairfield UK Birmingham London
Asia and Australia Americas
Clairfield Brasil Curitiba Sao Paulo Clairfield Chile Santiago de Chile Clairfield Mexico Mexico City Clairfield USA Atlanta Miami Minneapolis New York Phoenix Seattle Washington, D.C. Clairfield Australia Brisbane Clairfield China Hongkong Clairfield India Mumbai
German Offices
60