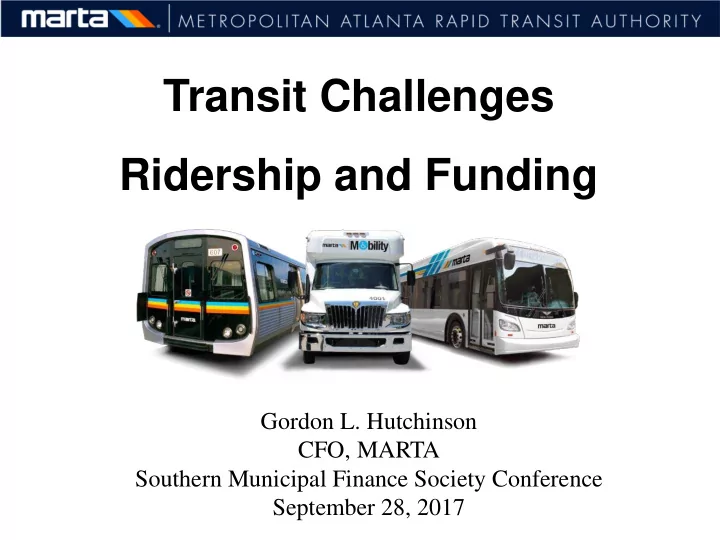

Transit Challenges Ridership and Funding Gordon L. Hutchinson CFO, MARTA Southern Municipal Finance Society Conference September 28, 2017
Summary Revenue Challenges • Grant Funding • Sales Tax • Ridership Potential Solutions • Sales Tax on Services • Transit Oriented Development • Technology Driven Solutions 2
Grant Funding Challenges • Low priority of current Administration for public transit “Trump's Proposed Transit Funding Cuts Are A Great Start On De-Federalizing Local Spendin g ” President Trump’s proposed budget will cut federal transportation spending by 13% All will come from transit projects – not highways Source: curbed.com [March 16, 2017], Forbes [April 2, 2017] 3
Sales Tax Challenges • Online e-commerce displacing traditional retailers • Shopping centers closing • Growth of the service based economy Many professional services are sales tax exempt 4
Ridership Challenges • Gentrification Impacts on Transit Customers • Ride Sharing Services • Low Fuel Prices 5
FY11 – FY17 Ridership Trend 145 (millions) 139.9 140 136.0 134.9 135 133.4 130 129.9 129.1 126.4 125 FY11 FY12 FY13 FY14 FY15 FY16 FY17 6 6
FY15 – FY16 Change in Ridership by Mode - MTA (millions) Source: The Greenlining Institute (Public Transit: Uber’s Next Casualty? [Aug. 3, 2017]) 7 7
MARTA Rider Profiles FY13 FY17 Household Income < $30,000 60% 46% African American 76% 68% Has Alternative 41% 47% Transportation Could have driven own car 29% 35% 8
Gentrification Threatens Public Transit Ridership • “New Report Finds That Gentrification in Transit-Rich Neighborhoods, Endangers Transit Ridership” • Gentrification is a pattern of neighborhood change marked by rising housing costs and incomes • Neighborhood renters are forced to pay more for housing • Vehicle ownership rises as incomes rise Source: Northeastern University Kitty & Michael Dukakis Center for Urban & Regional Policy [October 2010]); reprinted by Reimagine.org 9 9
The Trend of Low Income Housing in Atlanta • Since the mid-1990s, aging public housing stock has been replaced with new mixed-income communities • Reduced affordable housing amid new luxury developments Source: The Atlanta Journal Constitution (Team Picked to Transform former Atlanta Low-Income Housing Complex [July 19, 2016]) 10 10
The Trend of Low Income Housing in Atlanta Continued… • 5 percent loss of affordable units per year since 2012 Most new apartments since 2012 are luxury More than half of renters pay more than 30 percent of their monthly income on housing Source: The Atlanta Journal Constitution (Team Picked to Transform former Atlanta Low-Income Housing Complex [July 19, 2016]) 11 11
Public Transit – “A Lonely Road” • An example of the commute time for a transit dependent rider unable to afford intown housing: Two-hour commute - Three modes of transport. 12 12 Source: The Washington Post (A Lonely Road [December 28, 2015])
Potential Grant Funding Solutions • Explore increases in State and Municipal funding Expansion of sales tax Tax allocation districts State investment grants Access improvements in partnership with property developers 13 13
Potential Tax on Professional Services in Georgia • More than $1 billion dollars per year (in 2012 dollars) • Key Assumptions Over 100 types of services could be taxed Household purchases only Service Categories include: Politically challenging to Achieve Source: GSU Andrew Young School of Policy Studies (February 2011) 14
Sales Tax on Professional Services • Four (4) States Charge Sales Tax on Services South Dakota Hawaii West Virginia New Mexico • Five (5) States Charge Sales Tax on Less Than Twenty (20) Services Colorado Illinois Massachusetts Nevada Virginia 15 Source: accountexnetwork.com
Partial Solution - Transit Oriented Development Five or 10 years ago… Corporate site selection groups looked at MARTA just as a pro forma check the box. Today, mass transit is a real and important part of the decision making process. . 16
MARTA’s Transit Oriented Development (TOD) & Livable Housing • Station-area development • Convenient to live, work, shop, go to school, use the library, & play • Neighborhood Vibrancy – great lighting, sidewalks, access ways • Requires less parking than non-transit locations • Safety and beautification 17 17
MARTA’s Transit Oriented Development (TOD) & Livable Housing Continued… • MARTA values livable/affordable housing: Includes transit dependent riders Each TOD plan includes affordable housing Promote a sustainable, affordable , and growing future for Metro Atlanta 18 18
WALKABLE URBAN PLACES 14% 60% 26% 1990 - 2000 2000 - 2008 2008 - 2013 19
Transit-oriented development, or “TOD”, means development that is vibrant, pedestrian-friendly, and genuinely integrated with transit. 20
Technology Driven Solutions • Implementing Mobile Payments • Wi-Fi on Buses and Trains • Next Bus and Train Apps • See and Say App • Flexible bus routes and circulators 21 21
Questions…
Recommend
More recommend