
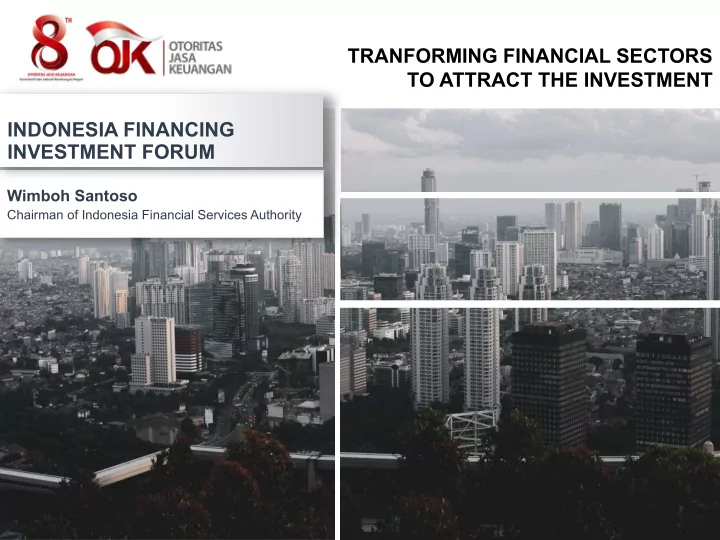
SLIDE 1
Wimboh Santoso
Chairman of Indonesia Financial Services Authority
INDONESIA FINANCING INVESTMENT FORUM TRANFORMING FINANCIAL SECTORS TO ATTRACT THE INVESTMENT
TRANFORMING FINANCIAL SECTORS TO ATTRACT THE INVESTMENT INDONESIA - - PowerPoint PPT Presentation
TRANFORMING FINANCIAL SECTORS TO ATTRACT THE INVESTMENT INDONESIA FINANCING INVESTMENT FORUM Wimboh Santoso Chairman of Indonesia Financial Services Authority MACRO-ECONOMIC AND FINANCIAL SECTORS CONDITION GLOBAL ECONOMIC SLOWDOWN Various
Wimboh Santoso
Chairman of Indonesia Financial Services Authority
INDONESIA FINANCING INVESTMENT FORUM TRANFORMING FINANCIAL SECTORS TO ATTRACT THE INVESTMENT
3
Various prominent institutions have made downward adjustments to global growth forecast
Previously projected at 2.6% (June’19)
3.7 3.3 3.6 3.6 3.0 3.4 2.7 2.9 3.1 3.3 3.5 3.7 3.9 2013 2014 2015 2016 2017 2018 2019 2020
WEO Oct'18 WEO April'19 WEO Oct'19 Downward revision of global economy projection in 2019 & 2020 by WEO
2019 Projection 2020 Projection Oct’18 Apr’19 Oct’19 Δ Oct’18 WEO Δ Apr’19 WEO Apr’19 Oct’19 Δ April’19 WEO World Output 3.7 3.3 3.0
3.6 3.4
AE 2.1 1.8 1.7
1.7 1.7 0.0 US 2.5 2.3 2.4
0.1 1.9 2.1 0.2 Japan 0.9 1 0.9 0.0
0.5 0.5 0.0 EMDEs 4.7 4.4 3.9
4.8 4.6
China 6.2 6.3 6.1
6.1 5.8
India 7.4 7.3 6.1
7.5 7.0
Brazil 2.4 2.1 0.9
2.5 2.0
South Africa 1.4 1.2 0.7
1.5 1.1
ASEAN-5 5.2 5.1 4.8
5.2 4.9
Indonesia 5.1 5.2 5.0
5.2 5.1
(revised in Sept’19)
(revised in Oct’19),
previously estimated at 3.2% (Jul’19)
(revised in Oct’19),
previously 3.2% (May’19)
4
Reserve Bank of India 25 bps to 5.15% The Central Bank of The Russian Federation 50 bps to 6.5% cut its benchmark 7-day reverse repo rate by another 25 basis points to 5.00 percent and has now cut it by 100 points following cuts in July, August, September and October in 2019 Bank Indonesia Reserve Bank of Australia 25 bps to 0.75% (3rd cut rate) Bangko Sentral ng Pilipinas 25 bps to 4% The Fed 25 bps 1.5-1.75%. 25 bps to 5% (4th cut rate)
Responding to the economic slowdown, majority of countries have adopted more accommodative monetary policy
Besides, several countries also imposed non-conventional policies such as Quantitative Easing by buying bonds through secondary market
Stable growth, driven by strong household consumption and stable inflation
3.13 0.00 1.00 2.00 3.00 4.00 5.00
3 8 13 18 Feb-17 Apr-17 Jun-17 Aug-17 Oct-17 Dec-17 Feb-18 Apr-18 Jun-18 Aug-18 Oct-18 Dec-18 Feb-19 Apr-19 Jun-19 Aug-19 Oct-19 % IHK (rhs) Vol Food Adm Price Inti (rhs)
% %
126.70 5000 10000 15000 20000 0.00 20.00 40.00 60.00 80.00 100.00 120.00 140.00 Feb-15 Jun-15 Oct-15 Feb-16 Jun-16 Oct-16 Feb-17 Jun-17 Oct-17 Feb-18 Jun-18 Oct-18 Feb-19 Jun-19 Oct-19 Cadangan Devisa Nilai Tukar (rhs) Reserve
Modest foreign exchange reserves (Oct 19 : USD126.70 billion) Inflation remains under control within 3,5% +-1% (Oct 19 : 3.13%)
5.01 4.88 5.03 5.07 5.17 5.07 5.05 5.02 2 2.5 3 3.5 4 4.5 5 5.5 6
2 4 6 8 10 12 2014 2015 2016 2017 2018 Q1 2019 Q2 2019 Q3 2019
Processing Industry Trade Agriculture Construction Mining Transportation Financial Services Information and Comm.
Growth PDB, yoy (%)
Indonesia Economic Growth has been maintained above 5% led by household consumptions
Poverty level decreased and reached the lowest level since 1998 6 Open unemployment rate showed a downward trend (Feb-19: 5.01%) Gini ratio improved
Poverty Level in million Poverty Level in % of total population
In the recent years, open unemployment rate has been decreasing, poverty has been declining and economic inequality has been narrowing
Men Women
JCI and Return Net Buy/Sell Stocks Net Buy/Sell Govt Bonds
18 Nov ‘19 Net Sell 18 Nov 2019 Net Sell
Govt Bond Yield Adequate FX Reserves
Source: Bloomberg, IBPA, CEIC Declining yield 102,4 bps ytd 4.0 5.0 6.0 7.0 8.0 9.0 10.0 0,1y 4y 8y 12y 16y 20y 24y 28y Yield (%) 18-Nov-19 22-Aug-19 28-Dec-18
170.33 57.1
1.37
174.62
2017 2018 30-Aug-19 30-Sep-19 31-Oct-19 18-Nov-19 ytd
16.17
44.02
2 1 5 2 1 6 2 1 7 2 1 8 3
e p
9 3 1
c t
9 1 8
9 m t d y t d 120.289.500 119.680.410 119.944.630
111.480.920
118.595.120 118.400.130
4,593 5,297 6,356 6,195 6,123
15.33 19.99
5 10 15 20 25
2,000 3,000 4,000 5,000 6,000 7,000
2015 2016 2017 2018 18-Nov-19
JCI (rhs) Return
Do Domestic financial market still resilient
8
2.72
2.0 2.2 2.4 2.6 2.8 3.0 3.2 3.4 2015 2017 Jun/18 Aug/18 Oct/18 Dec/18 Feb/19 Apr/19 Jun/19 Aug/19
Banking CAR
Life and General Insurance RBC above the threshold (120%) Multifinance Gearing Ratio
threshold 10%
23.38 21.64 15 17 19 21 23 25
Sep-15 Dec-15 Mar-16 Jun-16 Sep-16 Dec-16 Mar-17 Jun-17 Sep-17 Dec-17 Mar-18 Jun-18 Sep-18 Dec-18 Mar-19 Jun-19 Sep-19 CAR % (rhs) Tier I % 667% 321% 250% 290% 330% 370% 300% 360% 420% 480% 540% 600% 660% 720% Jan-18 Mar-18 May-18 Jul-18 Sep-18 Nov-18 Jan-19 Mar-19 May-19 Jul-19 Sep-19
RBC Asuransi Jiwa RBC Asuransi Umum (RHS)
Liquidity is ample Liquid Asset to NCD around 93.9% (as of 6 Nov 2019) RIM (Intermediation Ratio), LDR, AND LFR 93.91 19.70 5 10 15 20 25 40 60 80 100 120 10-May 20-May 30-May 9-Jun 19-Jun 29-Jun 9-Jul 19-Jul 29-Jul 8-Aug 18-Aug 28-Aug 7-Sep 17-Sep 27-Sep 7-Oct 17-Oct 27-Oct 6-Nov % % AL/NCD (LHS) AL/DPK (RHS)
threshold AL/NCD=50% threshold AL/DPK=10%
7.89 7.47 93.76 84.00 86.00 88.00 90.00 92.00 94.00 96.00 98.00
4.00 6.00 8.00 10.00 12.00 14.00 16.00 Nov-16 Jan-17 Mar-17 May-17 Jul-17 Sep-17 Nov-17 Jan-18 Mar-18 May-18 Jul-18 Sep-18 Nov-18 Jan-19 Mar-19 May-19 Jul-19 Sep-19 Kredit DPK LDR (rhs)
Credit Growth by Economic Sector (yoy)
5.94% 12.84% 6.82% 7.89% 0% 2% 4% 6% 8% 10% 12% 14% 16% 18% Nov-15 Jan-16 Mar-16 May-16 Jul-16 Sep-16 Nov-16 Jan-17 Mar-17 May-17 Jul-17 Sep-17 Nov-17 Jan-18 Mar-18 May-18 Jul-18 Sep-18 Nov-18 Jan-19 Mar-19 May-19 Jul-19 Sep-19 Working Capital Investment Consumption Total 9.33%
5.59% 26.27% 4.25% 10.55% 8.28%
0% 10% 20% 30% 40% 50% Nov-15 Jan-16 Mar-16 May-16 Jul-16 Sep-16 Nov-16 Jan-17 Mar-17 May-17 Jul-17 Sep-17 Nov-17 Jan-18 Mar-18 May-18 Jul-18 Sep-18 Nov-18 Jan-19 Mar-19 May-19 Jul-19 Sep-19 Yoy (%) Agriculture MIning Processing Industry Construction Retail Transportation and Communication Households
Credit Third Party Fund
Third Party Fund, Credit (yoy) and LDR Credit of Invesment remains the main driver
Banking NPL by Economic Sector Multifinance NPF remains managable 10 Banking NPL remains below the threshold
2.66 1.15 0.00 1.00 2.00 3.00 4.00 Sep-15 Dec-15 Mar-16 Jun-16 Sep-16 Dec-16 Mar-17 Jun-17 Sep-17 Dec-17 Mar-18 Jun-18 Sep-18 Dec-18 Mar-19 Jun-19 Sep-19 % NPL Gross NPL Net 1.46 3.10 3.55 3.86 6.07 2.16 2.18 3.65 2 4 6 8 10 Sep-15 Dec-15 Mar-16 Jun-16 Sep-16 Dec-16 Mar-17 Jun-17 Sep-17 Dec-17 Mar-18 Jun-18 Sep-18 Dec-18 Mar-19 Jun-19 Sep-19 % Pertanian Pertambangan Konstruksi Perdagangan Akomodasi Transportasi dan Komunikasi Rumah Tangga Industri Pengolahan
2.66% 2.50% 6.75%
0.00% 2.00% 4.00% 6.00% 8.00% 10.00% Sep-16 Nov-16 Jan-17 Mar-17 May-17 Jul-17 Sep-17 Nov-17 Jan-18 Mar-18 May-18 Jul-18 Sep-18 Nov-18 Jan-19 Mar-19 May-19 Jul-19 Sep-19
Total Pembiayaan Konvensional Pembiayaan Berdasarkan Prinsip Syariah
3.16% 3.47% 3.18% 2.96% 3.25% 3.15% 3.17% 2.71% 2.71% 2.82% 2.66% 1.31% 1.47% 1.16% 0.93% 1.17% 0.97% 1.08% 0.69% 0.62% 0.55% 0.51% 0.00% 0.50% 1.00% 1.50% 2.00% 2.50% 3.00% 3.50% 4.00% Q1 2017 Q2 2017 Q3 2017 Q4 2017 Q1 2018 Q2 2018 Q3 2018 Q4 2018 Q1 2019 Q2 2019 Q3 2019 NPF Gross NPF Netto Total Conventional Finance Sharia Finance
Multifinance NPF (Sharia and Conventional)
Agriculture Construction Accommodation Households Mining Trade Transportation & Comm. Processing industry
11
PROFITABILITY RETURN ON ASSETS BY BUKU NET INTEREST MARGIN BY BUKU
11
2.48
2.0 2.2 2.4 2.6 2.8 Sep-15 Jan-16 May-16 Sep-16 Jan-17 May-17 Sep-17 Jan-18 May-18 Sep-18 Jan-19 May-19 Sep-19 ROA 4.90 4.2 4.4 4.6 4.8 5.0 5.2 5.4 5.6 5.8 Sep-15 Feb-16 Jul-16 Dec-16 May-17 Oct-17 Mar-18 Aug-18 Jan-19 Jun-19 NIM 91.24 68 72 76 80 84 88 92 96 Sep-15 Feb-16 Jul-16 Dec-16 May-17 Oct-17 Mar-18 Aug-18 Jan-19 Jun-19
BOPO 2.48 1.20 1.53 1.78 3.10
1.00 1.50 2.00 2.50 3.00 3.50 ROA BUKU 1 BUKU 2 BUKU 3 BUKU 4 4.90 4.88 4.81 3.97 5.48
2.00 3.00 4.00 5.00 6.00 NIM BUKU 1 BUKU 2 BUKU 3 BUKU 4 13.3% 472.4%
50% 150% 250% 350% 450% Sep-15 Jan-16 May-16 Sep-16 Jan-17 May-17 Sep-17 Jan-18 May-18 Sep-18 Jan-19 May-19 Sep-19 Pendapatan Bunga Pendapatan Operasional Selain Bunga Pendapatan Non-Operasional
Commercial Bank Commercial Bank Commercial Bank
RETURN ON ASSETS OPERATING COST/REVENUE NET INTEREST MARGIN Interest earning Non-Interest earning Non-operational earning
2018 2019 Apr Jan Feb March Apr May
Moody’s: upgraded the rating at Baa2/Stable Fitch: affirmed the rating at BBB/ Stable JCR: affirmed the rating at BBB , revised the outlook to positive S&P: upgraded the rating at BBB/Stable R&I: affirmed the rating at BBB/ Stable
In Indonesi sia’s so sovereign cre credi dit ra rati ting has has st stable ou
from ke key ra rati ting age agencie ncies
Upgrade on Indonesia Sovereign Credit Rating
Source: World Bank
Indonesia has progressed significantly in promoting its business environment as the EoDB index ranking for 2019 has climbed 18 places to 73 from its previous rank of 91 in
its score by 1.42 points to 67.96 from 66.54 last year.
Along with policies to overcome the challenges
Maintain consumers purchasing power Transforming mining economy to manufacturing- based economy Seizing the
trade war Overcoming external imbalances
Inflation Rate needs to remain low Five priorities: manufacturing, agrobusiness, fishing, mining, and tourism. Simplify investment bureaucracy Export/import policy, tourism, economic diplomacy
Entrepreneurship Index ranks 94/137 countries in 2018
Entrepreneurship Index is still low
Efforts undertaken by OJK related to Financial market pillar: ü Apply mandatory portion of financing to productive sector ü Support the development of fintech startup ü Carry out financial consumer education programs,
Declining competitiveness
Maintained the same score as last year, Indonesia GCI rank declined from 45/140 to 50/141
Sumber:http://www3.weforum.org/docs/WEF_TheGlobalCompetitivenessReport2019.pdf
in 2018 to 50/141 in 2019.
pillar of Developed Financial Market. Efforts undertaken by OJK: a) Apply mandatory portion of financing to productive sector, for: § Bank: BUKU I at least 55%, BUKU II at least 60%, BUKU III at least 65%, and BUKU IV at least 70% of overall financing. § Multifinance: at least 10% b) Support the development of fintech startup c) Carry out financial consumer education programs, develop BWM, BUMDES / BUMADES, enhance the role of TPAKD. Global competitiveness rankings of Asia-Pacific countries/regions in 2019 Trend of Indonesia GCI Ranking
Sumber: http://www.doingbusiness.org/content/dam/doingBusiness/country/i/indonesia/IDN.pdf
Economy Overall Starting a Business Dealing with Construction Permits Getting Electricity Registering Property Getting Credit Protecting Minority Investors Paying Taxes Trading across Borders Enforcing Contracts Resolving Insolvency Singapore 2 3 8 16 21 32 7 8 45 1 27 Malaysia 15 122 3 4 29 32 2 72 48 33 41 Thailand 27 39 67 6 66 44 15 59 59 35 24 China 46 28 121 14 27 73 64 114 65 6 61 Brunei Darussalam 55 16 55 31 142 1 48 84 149 67 64 Vietnam 69 104 21 27 60 32 89 131 100 62 133 Indonesia 73 134 112 33 100 44 51 112 116 146 36 Philippines 124 166 94 29 116 184 132 94 104 151 63 Cambodia 138 185 179 141 124 22 110 137 115 182 79 Myanmar 171 152 81 144 136 178 185 126 168 188 164
OJK’S STEPS TO IMPROVE EODB INDONESIA:
Issue
reporting system/SLIK (Financial Information Services System) to all rural banks and finance companies
scoring service but also providing more credit information that has value added
EoDB stagnated at 73 this year
Indonesia GEI Score: 20.7 Rank 94
GEI Score: 52.7 Rank 27
GEI Score: 32.7 Rank 58
Malaysia Thailand
GEI Score: 27.4 Rank 71
Filipina GEI Score: 24.1 Rank 84 Singapura GEI Score: 23.2 Rank 87 Vietnam 3.10% 3.30% 5.00% 6.00% 14.00%
I n d
e s i a V i e t n a m T h a i l a n d M a l a y s i a a d v a n c e d c
n t r i e s
0.0% 10.0% 20.0% 30.0% 40.0% 50.0% 60.0% Commercial Banks Insurers & Social Security Agencies Multifinance Companies Pension Funds Indonesia Eximbank Pawnshop Equity Market Capitalization Outstanding Corporate Debt Securities Outstanding Gov't Debt Securities Mutual Funds
53.8% 8.6% 3.4% 1.9% 0.8% 0.4% 46.8% 16.6% 2.8% 3.2%
INDONESIA FINANCIAL INSTITUTIONS ASSETS/GDP To finance infrastructure projects and development of leading sectors: Tourism, Fishery, Manufacture (Textile, Automotive), Agribusiness, and Mining sector
Boost export and reduci ng i mport
PENGEMB ANGAN SEKTOR- SEKTOR UNGGULA N
20
Boost economi c growt h & economi c equal i t y Job creat i on & busi ness
Support Sust ai nabl e Devel opment Goal s
NEW ENGINE OF GROWTH
Downstream hilirization is necessary to boost the economy
OJK build collaboration with the Regional Government
with the Regional Government, Association
i n d e v e l o p i n g R e g i o n a l E c o n o m i c P o t e n t i a l A r e a s
OJK issued regulations to accelerate economic growth
Enable start-up company and small business to raise fund in capital market (through IPO, equity crowdfunding) Relaxing legal lending limit (BMPK) and risk weighted assets (ATMR) for priority sectors Enhance the role of securities companies to the regional economy and expanding access for the public to invest in the capital market
LICENSING CONSUMER PROTECTION FINTECH SURVEILLANCE REGULATION
Market conduct supervision for P2P lending
consumer from illegal fintech.
fintech has been stopped. Fully functioning fintech association (association will enact code of ethics and code of conduct) Three tiers licensing: Listed, Registered and Licensed
Fintech center (OJK Infinity) for knowledge sharing
SUPERVISION KNOWLEDGE SHARING
FINTECH ECOSYSTEM
22
C o ns um er pro tect io n C y ber s ecur it y D ata pr ivacy & m o ney launder ing D isto r t io n
Technology driven
Improving supply, demand and financial market infrastructures
SUPPLY SIDE
DEMAND SIDE INFRA STRUCTURE
Bonds and Sukuk Private Fund (RDPT) Infrastructure Fund (DINFRA) Stocks Equity Crowdfunding Hedging Instrument for Government Bond. Indonesia Government Bond Future (IGBF) Electronic public
(E-IPO) Integrated database system (DWH, SIPETRO) PROVIDE LONG TERM FINANCING Integrated licensing system (SPRINT) Consumer Protection & Expand Investor Base Disgorgement fund Indonesia Securities Fund (Lembaga Pendanaan Efek Indonesia) Regulatory & Physical Infrastructure Education Regional Securities Company E-book building Accelaration of settlement process T+3 into T+2 Expand Single Investor Identification (SID) Development of XBRL for issuers Municipal Bonds (OBDA) Central Java, West Java, DKI Jakarta Islamic Capital Market
Expand distribution channels: selling mutual fund in minimarket and branchless banking agents
Real Estate Investment Trust (REITs) Asset Backed Securities (EBA) EBA-SP (Surat Partisipasi) Green Bonds & Green Sukuk Project Bond
* SID as of September 2019
grew 42,8% ytd
24
E-Proxy & E- voting RUPS
Indonesia’s scores are still below neighboring countries
Expand financial access for MSMEs and communities in remote areas
Rp115,7 Trillion
Facilitated distribution
(82,68% from target Rp141,6 Trillion)
25,8 million
participants
Rp29,32 billion
(as of September 2019)
53 Micro Waqf Bank
20 BUMDES, 2 BUMR 1 BUM-Kampung
1,15 million agents Rp2,21 trillion 32 Province 106 City
350 thousands school 21,6 million account
Rp8,76T Rp31,9 T
OJK goes to Campus Financial Expo Wayang Show
Investment Alert Task Force In 40 areas 138 TPAKD
Village Owned Enterprises
Outstanding Saving
25,8 million customers Team for Acceleration of Regional Financial Access (TPAKD) OJK contact center
Branchless Banking
Financial education will be continued to support target 2019
INDEX 2016 29,7%
TARGET 2019 35%
I N C L U S I O N
INDEX 2016
TARGET 2019 Financial customer protection
NBFI REFORM
O-BOX
monitoring process
transactions
Integrated Registration and License System or SPRINT
An integrated system to process license & registration for banking/capital market/NBFIs products & institution/individual,
DATA WAREHOUSE
For banking, NBFI and capital market
B A N K I N G
SUFFICIENT GOODS AND SERVICES FOR DOMESTIC
PROMOTES INNOVATION
Source: Indonesia Investment Coordinating Board (BKPM)
Q3-2019 2018 USD9.193,2 mio USD1.948,8 mio USD881,4 mio USD4.952,8 mio USD1.023,4 mio USD2.376,5 mio Q3- 2019 2018 USD434,0 mio USD2.011,4 mio USD220,8 mio USD1.774,9 mio Q3- 2019 2018 USD1.358,0 mio USD943,1 mio
During Jan-Sept 2019, the investment realization in Indonesia has reached IDR 601.3 trillion (increased about 12,3% yoy). As of Q3 2019, the investment realization has achieved about 75.9%% from the 2019 target.
IDR trillion
FDI and DDI Investment Realization Based on Sector
Source: Indonesia Investment Coordinating Board (BKPM)
During Q3 2019, the investment has been dominated by Transportation, Warehouse, and Telecommuncation (19,1%), Electricity, Gas, and Water Supply (39,1%); and Construction (8,2%) During Q3 2019, the highest investment realization was situated within Java island: Jakarta (20%), West Jawa (16,2%), and East Java (7,2%). During Q3 2019 – Singapore, Netherland, and China became 3 largest investors for Indonesia
FDI and DDI Investment Realization Based on Location FDI and DDI Investment Realization Based on Country of Origin
OJK in coordination with fiscal authorities have issued several tax incentives to induce economic growth, among others:
that has high value added and externalities, introducing new technologies, and has a strategic implication to the national economy (PP No. 45/2019)
(PP No.55/2019)
Incentive to Attract Sustainable Finance Reduction of the industry’s contribution fee: 25% from registration and dan registration statement fee of green bond issuance
Capital Raising
IDR 148,02 trillion
From 144 IPOs, 43 of them are new issuers
14 38 58 43 42 34 35 28 15 11 74 88 82 86 15 148.02 50 100 150 200 250 300 10 20 30 40 50 60 70 80 90 100 2016 2017 2018 12-Nov-19 in process
IPO Right Issue Debt Securities and Sukuk (EBUS) Capital Raising (IDR Trillion)
Al Alternative financing in capital market
Investment Products and Asset Under Management Data as of 11 November 2019 unless indicated: * Data as of Sept 2019 ** since 2018
Re Representing an attractive investment with a low de default ault ri risk
34
North Sumatera East Kalimantan South Kalimantan West Sumatera DKI Jakarta West Java Central Java East Java Bali South Sulawesi
10 Potential Provinces To Issue Municipal Bonds which
amounted to USD8.69 Billion
Rated by Rating Agencies Endowment funds is budgeted annually by the local government for principal payments Providing flexibility in the use
Financial soundness of regional government is assessed by related ministry Indonesia is committed to deepen its financial market, giving more space for the development of municipal bonds
I N V E S T M E N T S I N I N D O N E S I A M U N I C I P A L B O N D S
Incentives for registration fees from 0.5% to 0.0125%
OJK simplified municipal bond procedures, but still ensuring sustainability and the ability of the local government to repay its debt
USD9.45 billion
Accumulated green loan granted
USD 669 million
Green bonds issuance of Government green SUKUK
USD3.2 billion
In term of blended finance, we are benefiting with strong commitment we have witnessed from global stakeholders during the last World Bank - IMF Annual Meeting in Bali.
± USD2.46 billion
commitment to finance
through
blended finance scheme
from various domestic and global stakeholders
6 projects
have just completed in 2018
are in progress
2 projects
will be started in 2019
are being prepared/ drafted
144
Registered/ Licensed Fintech P2P Lending
Equity Crowdfunding
Registered Companies
IDR
D e c a c o r n
Starts-up Companies
Decacorn
Unicorn
Digital Banking Banks Provided Digital Banking Services