
SLIDE 1
1
Emerging Europe Advanced Europe
Regional Economic Outlook
Spring 2018
E U R
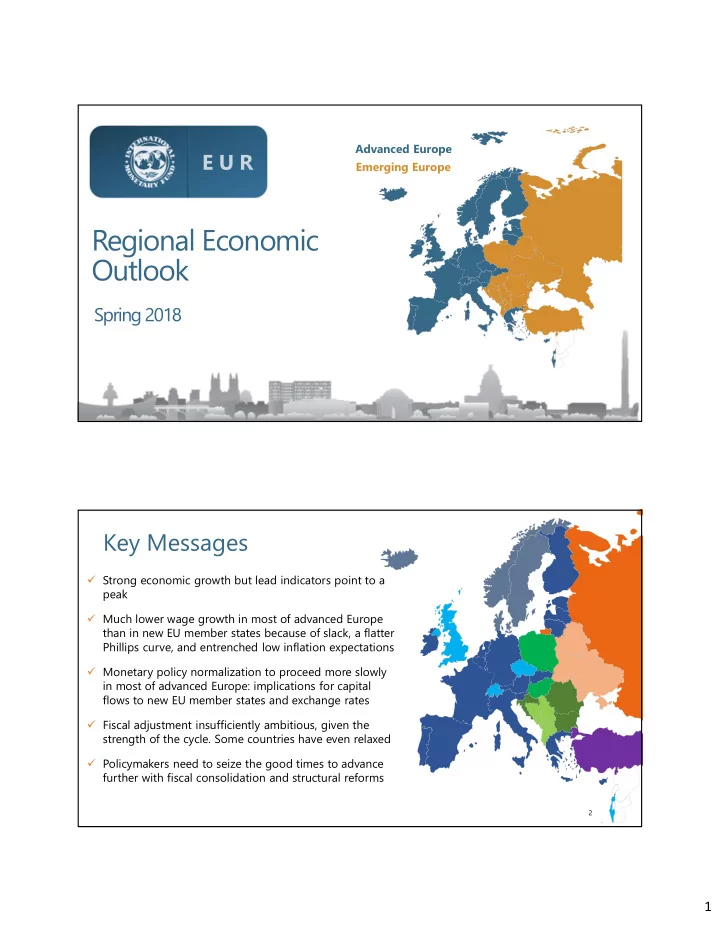
Key Messages
Strong economic growth but lead indicators point to a peak Much lower wage growth in most of advanced Europe than in new EU member states because of slack, a flatter Phillips curve, and entrenched low inflation expectations Monetary policy normalization to proceed more slowly in most of advanced Europe: implications for capital flows to new EU member states and exchange rates Fiscal adjustment insufficiently ambitious, given the strength of the cycle. Some countries have even relaxed Policymakers need to seize the good times to advance further with fiscal consolidation and structural reforms
2