
SLIDE 1
Hong Kong Child Safety Conference 2012 Hong Kong Child Safety Conference 2012
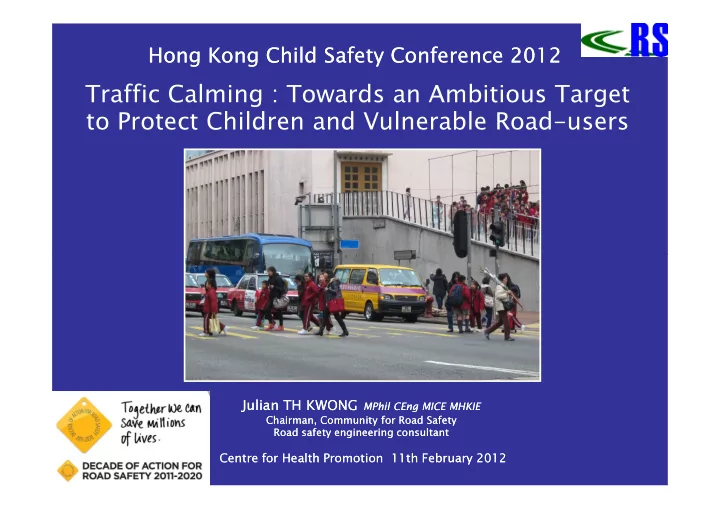
Traffic Calming : Towards an Ambitious Target to Protect Children and Vulnerable Road-users
Julian TH KWONG Julian TH KWONG MPhil CEng MICE MHKIE
MPhil CEng MICE MHKIE Chairman, Community for Road Safety Chairman, Community for Road Safety Road safety engineering consultant Road safety engineering consultant
Centre for Health Promotion 11th February Centre for Health Promotion 11th February 20 2012 12