
SLIDE 1
1
- T. S. Eugene Ng
Rice University
Guohui Wang, David Andersen, Michael Kaminsky, Konstantina Papagiannaki, Eugene Ng, Michael Kozuch, Michael Ryan, "c-Through: Part-time Optics in Data Centers”, SIGCOMM'10 Hamid Bazzaz, Malveeka Tewari, Guohui Wang, George Porter, Eugene Ng, David Andersen, Michael Kaminsky, Michael Kozuch, Amin Vahdat, "Switching the Optical Divide: Fundamental Challenges for Hybrid Electrical/Optical Datacenter Networks”, SOCC'11
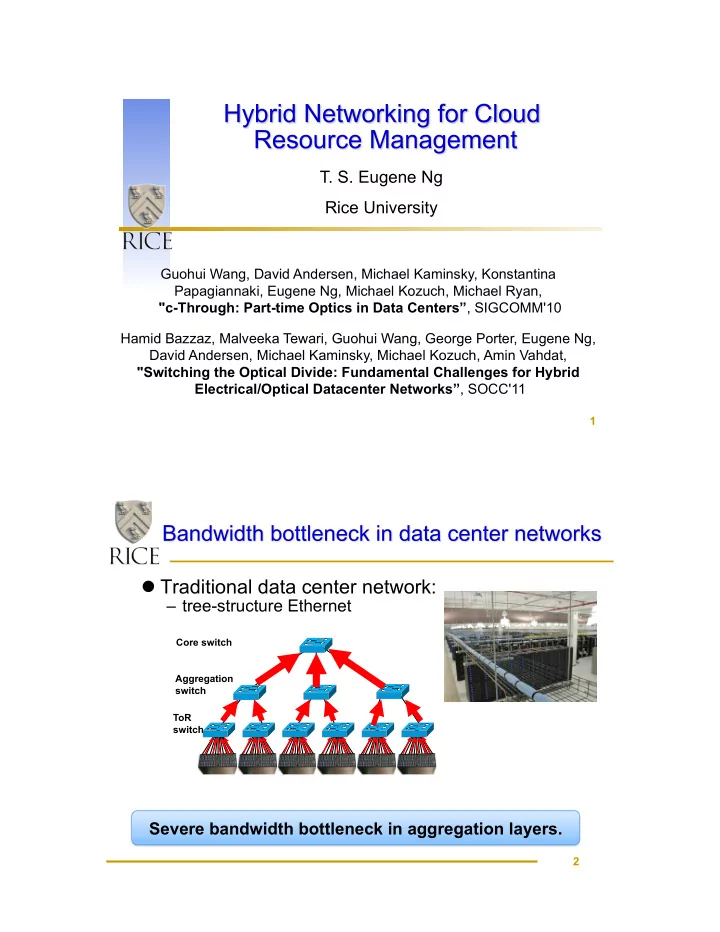
! Traditional data center network:
– tree-structure Ethernet
2
Aggregation switch ToR switch Core switch