Tracing the Evolution of Post-Starburst (E+A) Galaxies Using - - PowerPoint PPT Presentation

tracing the evolution of post starburst e a galaxies
SMART_READER_LITE
LIVE PREVIEW

Tracing the Evolution of Post-Starburst (E+A) Galaxies Using - - PowerPoint PPT Presentation

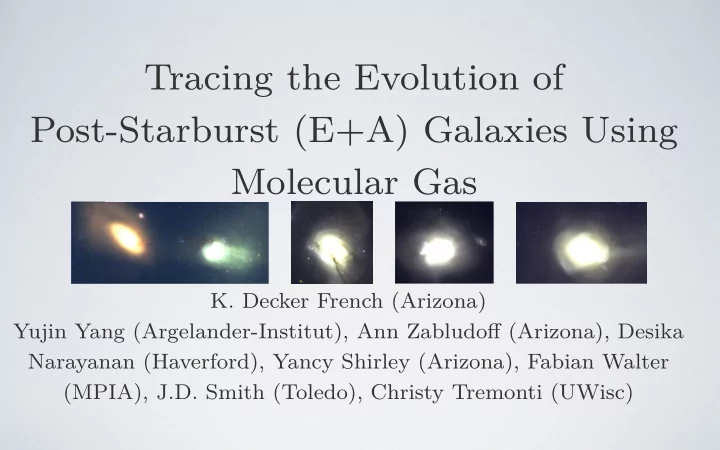
Tracing the Evolution of Post-Starburst (E+A) Galaxies Using Molecular Gas K. Decker French (Arizona) Yujin Yang (Argelander-Institut), Ann Zabludo ff (Arizona), Desika Narayanan (Haverford), Yancy Shirley (Arizona), Fabian Walter (MPIA), J.D.


slide-1
SLIDE 1
  • K. Decker French (Arizona)

Yujin Yang (Argelander-Institut), Ann Zabludoff (Arizona), Desika Narayanan (Haverford), Yancy Shirley (Arizona), Fabian Walter (MPIA), J.D. Smith (Toledo), Christy Tremonti (UWisc)

Tracing the Evolution of Post-Starburst (E+A) Galaxies Using Molecular Gas

slide-2
SLIDE 2

Why Post-Starburst Galaxies?

slide-3
SLIDE 3

Why Post-Starburst Galaxies?

Strong Balmer Absorption Weak H alpha Emission

What happened here?

slide-4
SLIDE 4

Detection of Molecular Gas

  • 32 galaxies with IRAM 30m in CO

(1-0) and CO (2-1)

  • 13 galaxies with SMT 10m in CO

(2-1)

slide-5
SLIDE 5

Detection of Molecular Gas

  • 32 galaxies with IRAM 30m in CO

(1-0) and CO (2-1)

  • 13 galaxies with SMT 10m in CO

(2-1)

  • Detect 17/32 galaxies in CO (1-0)
slide-6
SLIDE 6

Molecular gas masses comparable with star-forming galaxies

f(gas)= M(H2)/M★

Young+ 2011, Saintonge+ 2011

slide-7
SLIDE 7

Many post-starbursts are LINERs! Complicates star- formation rate

slide-8
SLIDE 8

Star-Formation-Rate vs. M(H2)

Gao&Solomon (2004), Saintonge+ (2011), Crocker+ (2011)

Upper limits Upper limits

slide-9
SLIDE 9

Molecular gas vs. star-formation rate surface densities

Kennicutt-Schmidt plot (Kennicutt 1998)

Upper limits Upper limits

slide-10
SLIDE 10

Why are post-starbursts offset?

  • CO-to-H2 conversion factor αCO
  • ULIRG type value can provide consistency, but: t(post-burst) >

t(dyn)

  • Stellar component not enough to lower αCO
slide-11
SLIDE 11

Why are post-starbursts offset?

  • CO-to-H2 conversion factor αCO
  • ULIRG type value can provide consistency, but: t(post-burst) >

t(dyn)

  • Stellar component not enough to lower αCO
  • Distribution?
  • Some evidence from CO (2-1) comparison that CO is not extended

enough to resolve offset

  • But, distribution of SF regions largely unconstrained
slide-12
SLIDE 12

Why are post-starbursts offset?

  • CO-to-H2 conversion factor αCO
  • ULIRG type value can provide consistency, but: t(post-burst) >

t(dyn)

  • Stellar component not enough to lower αCO
  • Distribution?
  • Some evidence from CO (2-1) comparison that CO is not extended

enough to resolve offset

  • But, distribution of SF regions largely unconstrained
  • Lowered star-formation efficiency? Bottom-heavy initial mass function?
slide-13
SLIDE 13

What caused the sudden end to star formation?

  • Gas used up?
  • Gas ejected or removed from galaxy?
  • Gas dispersed within galaxy?
  • Starvation?
  • Gas heated?
  • Morphological quenching? Other?
slide-14
SLIDE 14

What caused the sudden end to star formation?

  • Gas used up?
  • Gas ejected or removed from galaxy?
  • Gas dispersed within galaxy?
  • Starvation?
  • Gas heated?
  • Morphological quenching? Other?

→No, large molecular gas reservoirs →No, large molecular gas reservoirs →KS offset observed, need spatial info →No, large molecular gas reservoirs ? Something else must happen to the gas ?

slide-15
SLIDE 15

Next Steps

  • Denser gas tracers
  • HCN
  • Resolved CO emission
  • H alpha mapping to observe current

SF

  • ALMA, as well as current optical/

IFU facilities will help understand the state of the molecular gas and current activity in this critical period in galaxy evolution

Something else must happen to the gas KS offset observed, need spatial info

slide-16
SLIDE 16

Conclusions

  • Post-Starburst galaxies, in transition between star-forming and early

type

  • Molecular gas detected in ~half
  • M(H2) 108.6-109.8 Msol -- comparable to star-forming galaxies
  • Gas fractions 10-2 - 10-0.5 -- comparable to star-forming galaxies
  • Star formation rates ~10x lower
  • Post-starbursts fall low on molecular gas - star formation rate surface

density relation

  • Rule out complete gas consumption/expulsion/starvation as end of

starburst in this sample