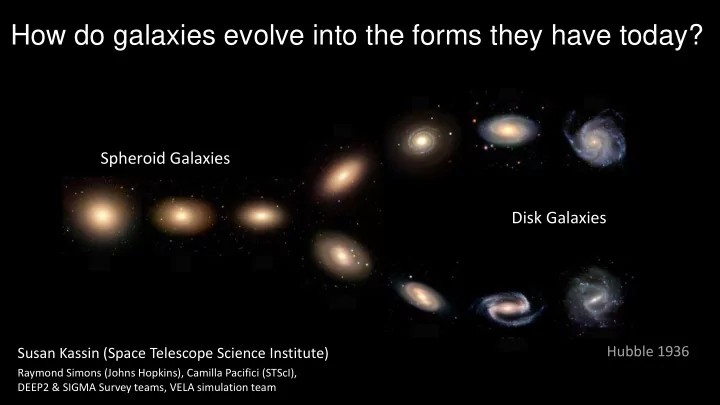
SLIDE 1 Disk Galaxies Spheroid Galaxies
Susan Kassin (Space Telescope Science Institute) Hubble 1936
Raymond Simons (Johns Hopkins), Camilla Pacifici (STScI), DEEP2 & SIGMA Survey teams, VELA simulation team
How do galaxies evolve into the forms they have today?
SLIDE 2
Galaxies at a redshift of 1 (8 billion years ago)
credit: AEGIS Survey
SLIDE 3
NGC 4414, credit: HubbleSite.org NGC 1132; credit: Hubble Heritage
What are galaxies?
SLIDE 4
How and when are disks assembled? How & when do disks obtain their current well-ordered state?
M63, credit: HubbleSite.org
SLIDE 5 Disk galaxies rotate under the influence of gravity
Weiner incl. Kassin et al. 2006
+200 km/s
Velocity map of a local disk galaxy
Sandage & Bedke 1988
NGC 7171 30”
SLIDE 6
How and when do quiescent spheroids form?
NGC 1132; credit: Hubble Heritage
SLIDE 7
- Disk Formation
- “Mass of Disk Formation”
- Assembly of disks over cosmic time
- Spheroid Formation
- Formation timescales vary with galaxy mass and redshift
- JWST observations of nascent galaxies
Outline
SLIDE 8
Models of Disk Formation and Evolution
Background
SLIDE 9
- 1. Angular momentum acquisition
e.g., White & Rees 1978; Fall & Efstathiou 1980; Blumenthal et al. 1984; Mo, Mao & White 1998; Dalcanton, Spergel, & Summers 1997
- 2. Baryons collapse to a disk
- 3. Collapse from the inside out (onion skin)
Analytic Model of Disk Collapse
- Disks start off well-ordered
- They grow in radius in an “onion skin” manner
SLIDE 10
Analytic & numerical theory: Tully-Fisher is tight
magnitude rotation velocity (km/s)
e.g., Mo, Mao, & White 1998; Sales et al. 2017
Luminosity ~ Velocity3
SLIDE 11 Dynamical theory of isolated disk evolution
Aumer, Binney, & Schönrich 2016 Stellar velocity dispersion (km/s) Time (Gyrs)
- Molecular clouds (e.g., Aumer, Binney, & Schönrich 2016)
- Merging satellites (e.g., Velazquez & White 1999)
- Buckling of bars (e.g., Debattista et al. 2006)
- Spiral structure
- Minor mergers (e.g., Moster et al. 2011)
Stars start off in a well-ordered and thin disk. Their velocity dispersion increases with time via:
SLIDE 12 Analytic Theory of an isolated disk
- Disks start off well-ordered and thin
- They thicken with time
- Disks lie on a tight Tully-Fisher Relation
- Disks grow in radius in an “onion skin” manner
We examine this picture with observations
- f galaxy kinematics at a range of redshifts.
SLIDE 13
- Disk Formation
- “Mass of Disk Formation”
- Assembly of disks over cosmic time
- Spheroid Formation
- Formation timescales vary with galaxy mass and redshift
- JWST observations of nascent galaxies
Outline
SLIDE 14 To study the evolution of galaxy kinematics, we need spectra and Hubble images for a hundreds of representative galaxies over a significant range in redshift and stellar mass.
- Star-forming galaxies on the “main sequence”
- No cuts on morphology
- Spectra from DEEP2 & SIGMA Surveys
(Newman et al. 2012, Simons, Kassin et al. 2017)
- Hubble images from AEGIS & CANDELS (Davis et al. 2007, Grogin et al. 2011)
- Total stellar mass is measured from multi-band photometry
Galaxy kinematics from z=3 to now
SLIDE 15
- We measure σ, which had not been done before, and Vrot
- We corrected Vrot and σ for the effects of seeing, which had not been done before.
- Slits are aligned to within 45° of galaxy major axes to measure Vrot
- We correct Vrot for inclination using Hubble image
Weiner inc. Kassin et al. 2006, Kassin et al. 2007, Covington, Kassin et al. 2010, Kassin et al. 2014
Hα
Galaxy kinematics are measured from emission lines
Simons, Kassin et al. 2016
z=2
wavelength radius radius velocity velocity dispersion radius
175 km/s 70 km/s
SLIDE 16
“Local” Tully-Fisher Relation at z=0.2
log rotation velocity Vrot (km/s)
Tully-Fisher “Ridge-line” from Reyes et al. 2011
log stellar mass (M⦿)
Simons, Kassin et al. 2015; also Bekeraite et al. 2016 (CALIFA), Bloom et al. 2017 (SAMI)
SLIDE 17
Ordered disks lie on ridge-line, Disturbed galaxies lie off of it
SLIDE 18
“Local” Tully-Fisher Relation (z~0.2)
Simons, Kassin et al. 2015; also Bekeraite et al. 2016 (CALIFA), Bloom et al. 2017 (SAMI)
SLIDE 19
“Local” Tully-Fisher Relation (z~0.2)
Simons, Kassin et al. 2015; also Bekeraite et al. 2016 (CALIFA), Bloom et al. 2017 (SAMI)
disks will form disks may not form
“Mass of Disk Formation”
SLIDE 20 Analytic Theory of an isolated disk
- Disks start off well-ordered and thin
- They thicken with time
- Disks lie on a tight Tully-Fisher Relation
- Disks grow in radius in an “onion skin” manner
Tully-Fisher falls apart for local low mass galaxies. Local low-mass star-forming galaxies are often not disks.
SLIDE 21
- Disk Formation
- “Mass of Disk Formation”
- Assembly of disks over cosmic time
- Spheroid Formation
- Formation timescales vary with galaxy mass and redshift
- JWST observations of nascent galaxies
Outline
SLIDE 22
6”
s dominated
z~1 HST
mixed
z~1 HST
z~1 HST
Vrot dominated
Gas kinematics tell us about the physical state of galaxies
75 km/s 55 km/s 29 km/s 59 km/s Vrot Vrot sini = 208 km/s s= 40 km/s spatial, 8” 1” 0.75”
SLIDE 23 6”
s dominated
z~1 HST
mixed
z~1 HST
z~1 HST
Vrot dominated
Gas kinematics tell us about the physical state of galaxies
σ is a gas velocity dispersion.
- Integrates over velocity gradients on scales below the seeing
- Quantifies disordered motions in galaxies
(Weiner et al. 06, Kassin et al. 2007, Covington, Kassin et al. 2010)
- Does not indicate a thick disk like in the Milky Way (Gilmore & Reid 1983)
1” 0.75”
SLIDE 24
Tully-Fisher Relation at z~0.2
Kassin et al. 2007
log Vrot (km/s) log stellar mass (M⦿)
SLIDE 25
log stellar mass (M⦿)
Tully-Fisher Relation from z~0.2 to z~2
Kassin et al. 2007; Simons, Kassin et al. 2016
log Vrot (km/s)
z~0.2 z~0.5 z~0.8 z~1 z~2
SLIDE 26 log stellar mass (M⦿) log stellar mass (M⦿) log Vrot (km/s) log S0.5 (km/s) S0.5
2 0.5Vrot 2 + s2 z~0.2 z~0.5 z~0.8 z~1 z~2
SLIDE 27
Do Vrot and σ evolve with time?
SLIDE 28
Kassin et al. 2012, Simons, Kassin et al. 2017, σ trend also Wisnioski et al. 2015 & Turner et al. 2017
The evolution of galaxy kinematics
redshift Vrot (km/s) σ (km/s) redshift
109 – 1010 M M★ = 1010 – 1011 M
Representative star-forming galaxies, no cut on morphology
SLIDE 29 NGC 4388, credit: ESA/Hubble & NASA
Let’s characterize disk galaxies:
- Vrot/σ ~ 10 (local massive disks)
- Vrot/σ > 3 (analog of local low mass disks)
- Vrot/σ > 1 (barely rotation supported)
How does the fraction of disk galaxies evolve?
SLIDE 30
z=1, Hubble/ACS V+I
V/σ = 5.6 V/σ = 4.9 V/σ = 3.4 V/σ = 2.5 V/σg = 1.8 V/σg = 1.6
V/σ > 3 V/σ < 3
V/σ is correlated with visual morphology
6” Ordered kinematics & morphology Disordered kinematics & morphology
SLIDE 31 Evolution of the fraction of the disk fraction
1010 – 1011 M 109.5 – 1010.5 M 109 – 1010 M fraction of star- forming galaxies with V/σ>1 redshift
Kassin et al. 2012; Simons, Kassin et al. 2016 & 17 V/s = 1.6 z~1 HST
SLIDE 32
Quantitatively, surveys agree
1010 – 1011 M 109.5 – 1010.5 M 109 – 1010 M fraction of star- forming galaxies with V/σ>1 redshift
Kassin et al. 2012; Simons, Kassin et al. 2016 & 17
SLIDE 33
Disk Assembly
At z~2, most galaxies were not disks
fraction of star- forming galaxies with V/σ>3 1010 – 1011 M 109.5 – 1010.5 M 109 – 1010 M
z~1 HST V/s = 3.4 Kassin et al. 2012; Simons, Kassin et al. 2016 & 17
redshift
Disk Settling
SLIDE 34 Analytic Theory of an isolated disk
- Disks start off well-ordered and thin
- They thicken with time
- The Tully-Fisher relation has little scatter
- Disks grow in radius in an “onion skin” manner
Disks start off with lots of disordered motions. They lose disordered motions and “thin out” with time. Disks grow in radius, but not in an orderly manner. Tully-Fisher has large scatter to low rotation velocity.
My observations
SLIDE 35
Nbody Shop at U. Washington (courtesy Governato)
SLIDE 36
- Disk Formation
- “Mass of Disk Formation”
- Assembly of disks over cosmic time
- Spheroid Formation
- Formation timescales vary with galaxy mass and redshift
- JWST observations of nascent galaxies
Outline
SLIDE 37
NGC 1132; credit: Hubble Heritage
How and when do quiescent spheroids form?
SLIDE 38
- Classical picture that dominated for decades:
- Formed in a single burst in the early universe
(Partridge & Peebles 1967; Larson 1975)
- Mergers of disks can also form an early type
(Toomre & Toomre 1972; Toomre 1977)
- Breakthrough (Bell et al. 2006, Faber incl. Kassin et al. 2007) :
- Quiescent galaxies increase in numbers by a factor of 2-4 over the last 8 billion
years since z~1, so all could not have formed in a single burst in the early universe (see also e.g., Faber et al. 1995)
- Quiescent spheroids must form from star-forming disks
Star-forming galaxies continuously add to the quiescent population, but it’s still unclear how.
How do quiescent spheroids form?
SLIDE 39
NGC 4414, credit: HubbleSite.org NGC 1132; credit: Hubble Heritage
What is the path from star-forming disks to quiescent spheroids (“quenching”)?
?
SLIDE 40
stellar mass color What is the path from star-forming disks to quiescent spheroids (“quenching”)?
Pacifici, Kassin et al. 2016
We investigate this with measurements of the star-formation histories of quiescent galaxies.
SLIDE 41
- Fit the photometry of ~850 quiescent galaxies with a library of galaxy models.
Models vary in terms of SFH, metallicity, stellar mass, age, etc.
- The model SFHs are physically motivated
- Determine the best-estimate SFH for each galaxy by averaging the model
SFHs weighted by their likelihoods
U HST/ACS HST/WFC3 Spitzer/IRAC
data model
magnitude residuals wavelength (microns) Pacifici, Kassin et al. 2016
Measurement of Star-Formation Histories (SFHs) via model fits to galaxy photometry
SLIDE 42
Realistic star-formation histories are adopted from from simulations
Pacifici, Kassin et al. 2016
Classic SFHs Our SFHs
Delayed Declining Rising Exponential functions of time
SLIDE 43
Galaxies form hierarchically. This is reflected in their star-formation histories
log specific star-formation rate (10-10 yr-1)
SFHs of nearby galaxies are stochastic
Weisz et al. 2013 Wechsler et al. 2002
SLIDE 44
SFR (M◉ yr-1) lookback time (Gyr) today past
Best-estimate SFH
Pacifici, Kassin et al. 2016
Best-estimate SFH for a single galaxy: Average over library SFHs weighted by likelihoods
25 best-fit models for the galaxy (greyscale)
SLIDE 45
Median SFH of galaxies in a bin of stellar mass & z
Median SFH for M* & z bin Interquartile range Individual galaxies (greyscale) Pacifici, Kassin et al. 2016
z~0.3 log M*(M◉) ~ 11 24 galaxies
SFR (M◉ yr-1) lookback time (Gyr)
SLIDE 46
Pacifici, Kassin et al. 2016
SFR (M◉ yr-1) lookback time (Gyr)
z~0.3 z~0.6 z~0.8 z~1.1 z~1.5 z~2.0
log(M/M)~9 ~9.5 ~10 ~10.5 ~11 ~11.5
SLIDE 47
stellar mass color What is the path from star-forming disks to quiescent spheroids (“quenching”)?
Pacifici, Kassin et al. 2016
SLIDE 48
Quiescent galaxies show average trends in SFHs with mass and redshift
Star- formation rate Pacifici, Kassin et al. 2016 time stellar mass color
Dynamical timescales are short (~1 Gyr at z=2), so consistent with gas accretion being stopped quickly and residual gas being used up. Gas accretion is stopped, and galaxies use up their residual gas slowly. Catastrophic event such as stripping or strong feedback.
high mass, high z: form fast, quench fast high mass, low z: form fast, quench slowly low mass, low z: form slowly, quench fast
SLIDE 49
- Disk Formation
- “Mass of Disk Formation”
- Assembly of disks over cosmic time
- Spheroid Formation
- Formation timescales vary with galaxy mass and redshift
- JWST observations of nascent galaxies
Outline
SLIDE 50
What will we learn about kinematics from JWST?
SLIDE 51
Vrot (km/s) σ (km/s)
How do the kinematics of the earliest galaxies evolve?
Kassin Cycle 1 Science
redshift redshift
1010 – 1011 M 109 – 1010 M ?
?
SLIDE 52
ScienceWise, Magazine, ANU
The JWST/NIRSpec IFU
IFU observations give a spectrum in each pixel. We can create kinematic maps of galaxies from this.
3”
SLIDE 53
Individual shutters: 0.2" x 0.46"
The JWST/NIRSpec Micro-Shutter Array (MSA)
4 x 365 x 171 = 250k Shutters up to ~100 objects observable simultaneously
3.4’ 3.6’
SLIDE 54
“Slitlet Stepping” to create IFU-like maps
z=3
SLIDE 55 Simons, Kassin, Snyder submitted
VELA simulation (Ceverino et al. 2014, 16)
+200 km/s
KMOS: 0.2”/pixel, 0.7” seeing NIRSpec: 0.1”/pixel, 0.05” resolution
Mock observations of a simulated merger at z=2
SLIDE 56
Simons, Kassin, Snyder et al. submitted
Mis-identifying disk galaxies in mock observations of mergers at z~2 Fraction of sight lines where a merger is taken for a disk average angular separation (arcsec)
Criteria 1-5 (Wisnioski+15) Criteria 1-5 + one additional all misidentified none misidentified
SLIDE 57
Nbody Shop at U. Washington (courtesy Governato)
SLIDE 58 Cycle 1 proposal: PI Susan Kassin 70 Co-Is JWST NIRSpec R~2700 MSA Survey:
- ~80 Galaxies in 2 areas in the CANDELS
fields
- z = 2 - 6
- ~5-20 hours per “slitlet step”
JWST: Kinematics from z=2 to the end of reionization
This is why I came here!
SLIDE 59 What our work has shown
At high z, galaxies are highly disordered and only just assembling. They later settle to disks. Higher mass galaxies are always the most evolved. There is a “Mass of Disk Formation” in the local universe, above which disks always form, but below which they find it hard to.
Galaxy quenching time evolves with mass and redshift, its faster at low mass and high redshift.
- JWST kinematic maps will enable us to determine the dynamical state
- f galaxies soon after reionization.