SLIDE 1
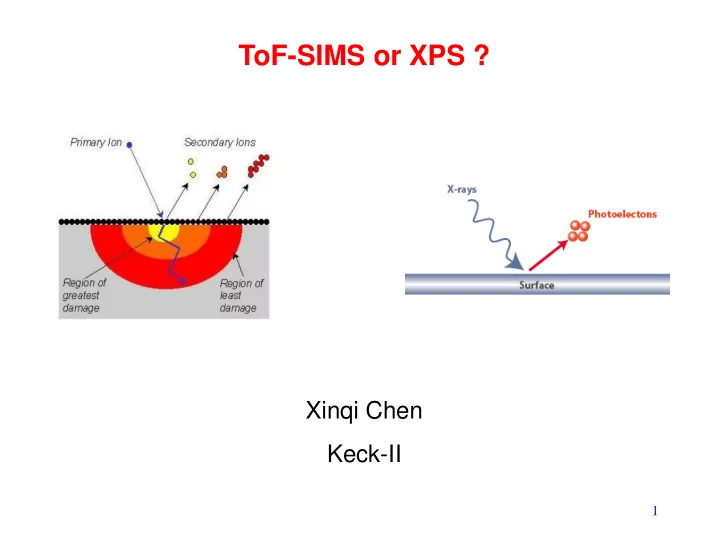
ToF-SIMS or XPS ?
Xinqi Chen Keck-II
1
SLIDE 2
Time of Flight Secondary Ion Mass Spectrometry (ToF-SIMS) X-ray Photoelectron Spectroscopy (XPS)
Not ToF MS (laser, solution)
2
SLIDE 3
3
SLIDE 4
Modes of SIMS
4
SLIDE 5
Secondary Ion Sputtering Process
5
SLIDE 6
Definition of Static SIMS
6
SLIDE 7
Exceeding Static SIMS
7
SLIDE 8 STM Before & After Static SIMS
Si surface Si surface exposed to 3 x 10¹² ions/ cm2
H.J.W. Zandvliet et al. in SIMS VIII Proceedings
8
SLIDE 9
Basic Principles
9
SLIDE 10
10
SLIDE 11 Positive spectrum of MoS2 monolayer
Li7 Na23 K Ga Mo MoS MoS2
11
SLIDE 12
Images of Al Metal Matrix Composite Heat Treatment: 500oC, 6 hr.
12
SLIDE 13
TOF-SIMS Imaging of PET-Biotin
13
SLIDE 14
Depth profiling
14
SLIDE 15
Comparison of Analyzed Volumes
15
SLIDE 16
Boron Implant Depth Profile
16
SLIDE 17 Depth profile of a Cr/Ni multi-layer standard using a 2 nA, 15 kV Ga+ beam in the
- ne-beam phase depth profiling mode. At this impact energy of 12 keV, the layers are not
resolved beyond the second Ni layer.
200 400 600 800 1000 Depth (nm) 1 2 3 4 5 10 10 10 10 10 10 Counts Ni Cr
Nickel (60 nm) Chromium (60 nm) 17
SLIDE 18 Depth profile of a Cr/Ni multi-layer standard using a 2 nA, 5 kV Ga+ beam in the
- ne-beam phase depth profiling mode. At this impact energy of 2 keV, the layers are well
resolved throughout the entire structure.
100 200 300 400 500 600 700 Depth (nm)
1 2 3 4
10 10 10 10 10 Counts Ni
54Cr
Nickel (60 nm) Chromium (60 nm) 18
SLIDE 19
Post analysis with raw data
19
SLIDE 20
- Detection of All Elements – H, He, Li, etc.
- Isotopic Detection – 2H, 3H, 18O, 13C, etc.
- Trace Sensitivity – ppm to ppb range
- High Spatial Resolution
- –Typical Lateral Resolution < 100nm
- Parallel Detection of All Masses
- Detailed Molecular Information – organic or inorganic
- Molecular Imaging
- 3D profiling
- Analysis of All Materials – conductor, semiconductor, insulator
Advantage of ToF-SIMS
20
SLIDE 21
- Secondary ion yields are often highly dependent on the matrix
- Secondary ion yields vary by more than six orders of magnitude
across the elements
- Destructive
- Well-characterized reference standards that are as close as
possible to the matrix of the samples of interest are needed for quantification
- Qualitative
- Data interpretation could be difficult.
Disadvantages
21
SLIDE 22
Time of Flight Secondary Ion Mass Spectrometry (ToF-SIMS) X-ray Photoelectron Spectroscopy (XPS)
22
SLIDE 23
23
SLIDE 24
Boron Implant Depth Profile
24
SLIDE 25 Figure 7. Dual-beam phase depth profile using 1 keV O2
+ for sputtering and 15 keV Ga+
for analysis. Oxygen flood was used. Each cycle consisted of a 10 sec. acquisition phase and a 2 sec. sputter phase. The depth resolution, as measured by the depth over which the B+ intensity dropped by 1/e, was measured to be 1.6 nm. 10 20 30 40 50 60 Depth (nm) 1 2 3 4 5 10 10 10 10 10 10 Counts
30Si 11B
250 eV BF2
+
Si
d = 1.6 nm
25
SLIDE 26 Exploring the inner space… NUANCE Center
Depth profiling by Ion Sputtering
Ar Ion
SLIDE 27
- Detection of All Elements – H, He, Li, etc.
- Isotopic Detection – 2H, 3H, 18O, 13C, etc.
- Trace Sensitivity – ppm to ppb range
- High Spatial Resolution
–Typical Lateral Resolution < 100nm
- Parallel Detection of All Masses
- Fast Acquisition (non-destructive analysis)
- Topographical Information
–Typical Ion-Generated SEI of 40 - 60nm
- Detailed Molecular Information – organic or inorganic
- Molecular Imaging
- Analysis of All Materials – conductor, semiconductor, insulator
Advantage of TOF-SIMS
27
SLIDE 28 XPS Depth Profile Analysis of a 10-Layer Low-E Glass Coating (Example-3)
10 20 30 40 50 60 70 80 90 10 20 30 40 50 60 70 80 90 100 110 120 130 140 150
Atomic percent (%) Etch Depth (nm)
XPS Chemical State Depth Profile (All 10 layers are clearly resolved!)
Al2p Si2p N Si2p Ox C1s C-C/C-H C1s carbonate Ca2p3 Ag3d N1s Sn3d5 O1s Cr2p3 Ni2p3 metal Ni2p3 oxide Zn2p3 Na1s Mg1s
- 500 eV Ar+ ions; > 1µA beam current
- 200 µm X-ray spot size
- 2.5 mm x 5 mm raster area
- Azimuthal rotation of sample
- Charge compensation used
Model of 10-Layer Film Stack Ag Ag Glass Substrate SnO2 Si3N4 Si3N4 SnO2 ZnO ZnO Nioxide/Nimetal
(Approximate relative thicknesses only.)
Glass 28
SLIDE 29
Variation in Sampling Depth with Angle-Resolved XPS (ARXPS)
29
SLIDE 30
30
SLIDE 31
X-ray Sample Electron Energy Analyzer Ion Gun Neutralizer UV light source
Ultraviolet Photoelectron Spectroscopy (UPS)
Noble gas discharge lamp He I = 21.2 eV ± 0,01eV He II = 40.8 eV ± 0,01 eV KE = hv – BE - Ø
31
SLIDE 32
Exploring the inner space… NUANCE Center
XPS UPS
1486.6 eV 21.2 eV
SLIDE 33 Exploring the inner space… NUANCE Center
Core electrons Valence electrons UV source Free electron proton neutron electron electron vacancy
Valence Electrons
SLIDE 34 UPS spectrum of Au surface
Schematic energy diagram of a metal. Schematic energy diagram of a semiconductor. Work function = 21.21 - 15.9 = 5.31 step
Literature value 5.3 eV
34
SLIDE 35 Comparison table
XPS ToF-SIMS SEM-EDX In X-ray Ion beam such as Ga, Au cluster, or Bi cluster Electron beam
Photoelectron Secondary ion X-ray Sampling depth Up to 10 nm Up to 5 nm 0.5 to 3um Information Elemental analysis except for H and He Chemical state Elemental analysis for all elements Elemental analysis above carbon Quantitative or qualitative Quantitative ±5% Semi-quantitative Quantitative ±15% Detection limit 0.1 at% ppm to ppb 0.5 weight% Elemental mapping spatial resolution >3 um <1 um 0.3 um Analysis spot size 20 um to 900 um 1 um to 800 um 10 nm Depth profiling Yes Yes No Insulating sample Yes Yes Need Au coating Data interpretation Easy Difficult Easy Surface damage Non-destructive Destructive Non-destructive
35
SLIDE 36 Which instrument should be chosen for analysis?
- 1. Mapping MoS2 flakes?
- 2. Check Fe2+ and Fe3+ ratio?
- 3. Concentration change along the depth?
- 4. Measure work function of a metal film?
- 5. Detect nitrogen or sulfur for monolayer molecular film?
- 6. Identify unknown spot?
- 7. Gel or solution sample?
36
SLIDE 37
Thank you!
37
SLIDE 38
38