
TO: Board of Education FROM: David D. Hart, Chief Financial Officer DATE: May 11th, 2012 SUBJECT: Responses to Questions from May 7th Finance and Audit Committee Meeting This memo contains responses to the questions received in conjunction with materials presented at the May 7th Finance and Audit Committee meeting. Unless otherwise noted, all references in this document are to the FY2012-2013 Proposed Budget slide deck. In the presentation posted to Board Docs changes are noted in green type font to distinguish them from changes made between the April and May meetings which are shown in red type font.
- Q1. What is the District’s required contribution to PERA?
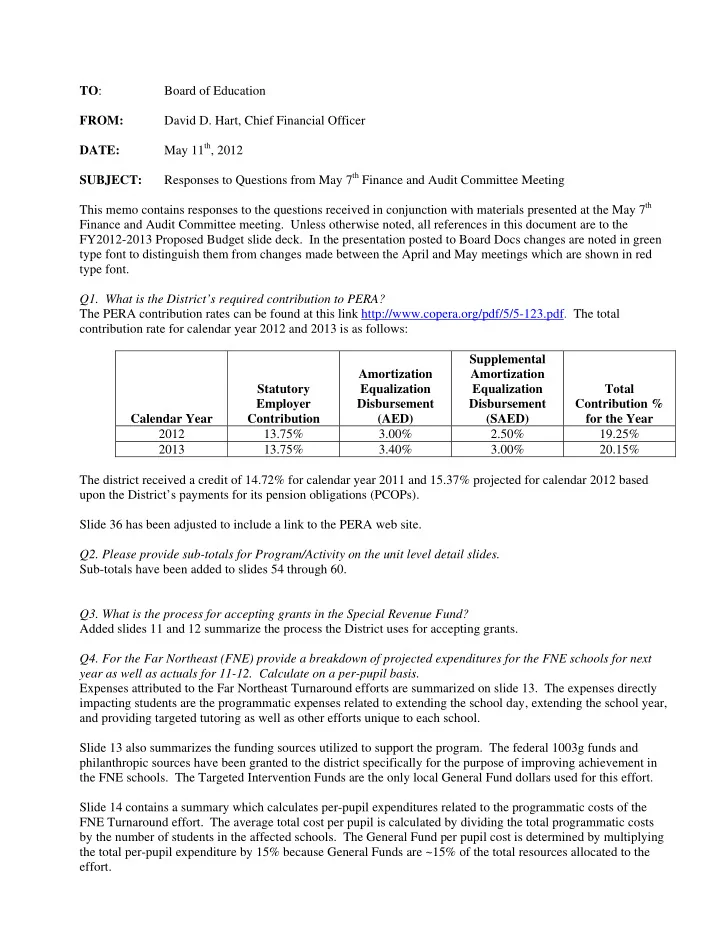
The PERA contribution rates can be found at this link http://www.copera.org/pdf/5/5-123.pdf. The total contribution rate for calendar year 2012 and 2013 is as follows: Calendar Year Statutory Employer Contribution Amortization Equalization Disbursement (AED) Supplemental Amortization Equalization Disbursement (SAED) Total Contribution % for the Year 2012 13.75% 3.00% 2.50% 19.25% 2013 13.75% 3.40% 3.00% 20.15% The district received a credit of 14.72% for calendar year 2011 and 15.37% projected for calendar 2012 based upon the District’s payments for its pension obligations (PCOPs). Slide 36 has been adjusted to include a link to the PERA web site.
- Q2. Please provide sub-totals for Program/Activity on the unit level detail slides.
Sub-totals have been added to slides 54 through 60.
- Q3. What is the process for accepting grants in the Special Revenue Fund?
Added slides 11 and 12 summarize the process the District uses for accepting grants.
- Q4. For the Far Northeast (FNE) provide a breakdown of projected expenditures for the FNE schools for next
year as well as actuals for 11-12. Calculate on a per-pupil basis. Expenses attributed to the Far Northeast Turnaround efforts are summarized on slide 13. The expenses directly impacting students are the programmatic expenses related to extending the school day, extending the school year, and providing targeted tutoring as well as other efforts unique to each school. Slide 13 also summarizes the funding sources utilized to support the program. The federal 1003g funds and philanthropic sources have been granted to the district specifically for the purpose of improving achievement in the FNE schools. The Targeted Intervention Funds are the only local General Fund dollars used for this effort. Slide 14 contains a summary which calculates per-pupil expenditures related to the programmatic costs of the FNE Turnaround effort. The average total cost per pupil is calculated by dividing the total programmatic costs by the number of students in the affected schools. The General Fund per pupil cost is determined by multiplying the total per-pupil expenditure by 15% because General Funds are ~15% of the total resources allocated to the effort.