Timeline of Sargassum horneri invasion in Southern California - - PowerPoint PPT Presentation

timeline of sargassum horneri invasion in southern
SMART_READER_LITE
LIVE PREVIEW

Timeline of Sargassum horneri invasion in Southern California - - PowerPoint PPT Presentation

T HE F AUNAL C OMMUNITIES A SSOCIATED WITH S ARGASSUM HORNERI Stephanie Saccardi Santa Barbara City College Biological Sciences M ENTOR : Lindsay Marks F ACULTY A DVISOR : Dan Reed Marine Science Institute Credit: Jack Engle F UNDED B Y :


slide-1
SLIDE 1

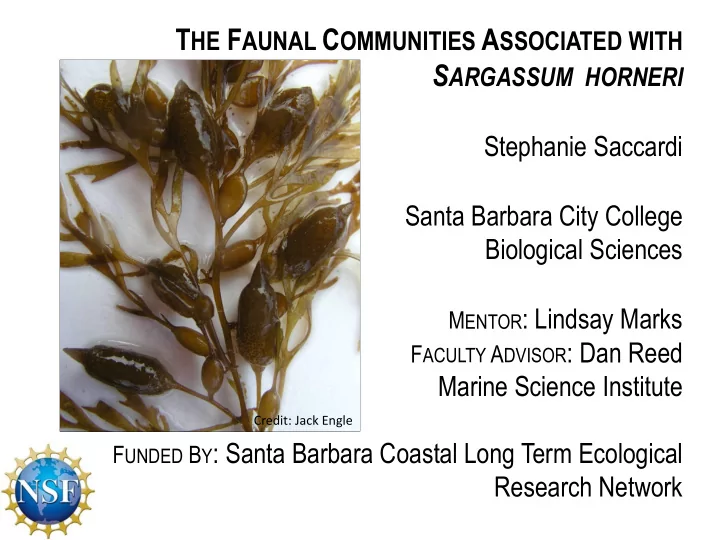
THE FAUNAL COMMUNITIES ASSOCIATED WITH SARGASSUM HORNERI

Stephanie Saccardi Santa Barbara City College Biological Sciences

MENTOR: Lindsay Marks FACULTY ADVISOR: Dan Reed

Marine Science Institute

FUNDED BY: Santa Barbara Coastal Long Term Ecological

Research Network

Credit: Jack Engle

slide-2
SLIDE 2

Timeline of Sargassum horneri invasion in Southern California

Credit: David J. Kushner

slide-3
SLIDE 3

Why care about invasive species?

Invasive species may cause harm to the environments they populate.

They can outcompete native species for food or resources… …and change the structure of food webs

Threatened biodiversity?

Credit: Jessie Alstatt Credit: Jack Engle

slide-4
SLIDE 4

Objectives:

  • 1. Determine abundance and variety of organisms colonizing on

Sargassum horneri

  • 2. Compare the communities found on Sargassum horneri to those
  • n native kelps

Senorita fish grazing S. horneri Lindsay collecting alga samples

Credit: Jack Engle

slide-5
SLIDE 5

Observing the microfauna on Sargassum horneri

Samples are sieved and placed in a sorting dish Lindsay collects samples of Sargassum Invertebrates are sorted, counted, and measured

slide-6
SLIDE 6

Class Ophiuroidea Brittle star Class Polychaeta Worm Suborder Gammaridea Gammarid Class Gastropoda Snails Family Idoteidae Isopod Order Decapoda Shrimp Suborder Caprellidea Caprellid Family Sphaeromatidae Isopod 25X 50X 25X 25X 25X 25X 50X 50X

6.25 mm 3.125 mm

slide-7
SLIDE 7

Assemblage of invertebrates differs among Macrocystis pyrifera and Sargassum horneri

2000 4000 6000 8000 10000 Gammarid amphipods 100 200 300 400 500 600 Shrimps 500 1000 1500 2000 2500 3000 3500 4000 Isopods 1000 2000 3000 4000 5000 6000 7000 Copepods 50 100 150 200 250 300 350 400 450 Mysids 1000 2000 3000 4000 5000 6000 7000 8000 Caprellid amphipods 8.6 3.2 25.0

# of individuals/kg wet algae

slide-8
SLIDE 8

Two different habitats to choose from:

Macrocystis pyrifera: morphologically simple Sargassum horneri: a more complexly structured habitat for invertebrates Credit: Jack Engle

Credit: bio.classes.ucsc.edu

slide-9
SLIDE 9

Invertebrate biomass is comparable between Macrocystis pyrifera and Sargassum horneri

500 1000 1500 2000 2500 3000 3500 4000 4500 Gammarid amphipods 200 400 600 800 1000 1200 Shrimps

mg invertebrate/kg wet algae

slide-10
SLIDE 10

Challenge: Redefining a new length-weight relationship

Dry Weight of Shrimp (mg) Length (mm) 1.5 1.0 10 5 2.0 Coyer’s Equation New Equation for Shrimp

slide-11
SLIDE 11

Future Directions

Sample all locations where Sargassum horneri has spread

Credit: www.noaa.gov

Temperature (°C)

slide-12
SLIDE 12

Acknowledgements

  • SBC LTER
  • MCR LTER
  • INSET
  • NSF