
SLIDE 1
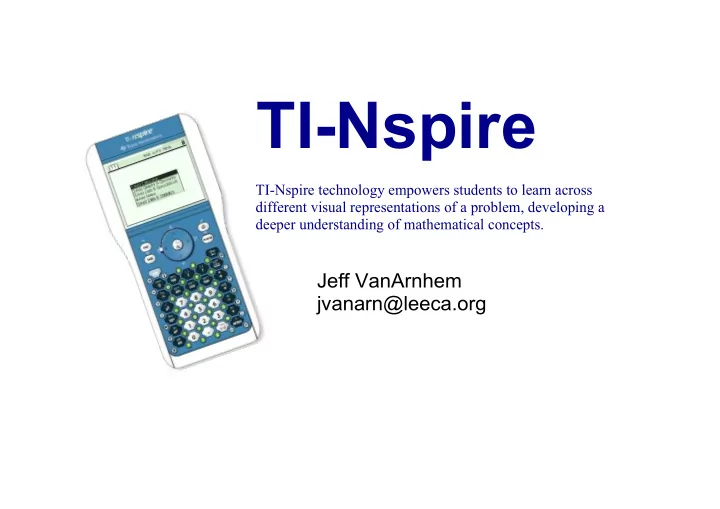
TINspire
Jeff VanArnhem jvanarn@leeca.org
TINspire technology empowers students to learn across different visual representations of a problem, developing a deeper understanding of mathematical concepts.
TINspire TINspire technology empowers students to learn across - - PowerPoint PPT Presentation
TINspire TINspire technology empowers students to learn across different visual representations of a problem, developing a deeper understanding of mathematical concepts. Jeff VanArnhem jvanarn@leeca.org TINspire vs. TINspire CAS
Jeff VanArnhem jvanarn@leeca.org
TINspire technology empowers students to learn across different visual representations of a problem, developing a deeper understanding of mathematical concepts.
TINspire vs. TINspire CAS
The Keypad...
Navpad common symbols alphabet Home (document
Menu (application
sensitve) Grab Keyboard Shortcuts...
DocumentBased File System
Let's create a New Document
1.1
problem page
"pretty print" mathematical templates
CAS
menu options
Check out the "context sensitive" menu options. Hit Ctrl + Multiplication to access the math templates
Let's define a function on this page!!
= for comparison & := for assignment
Graphs and Geometry
menu (context sensitive)
Let's try a Graph
ctrl
+
To go to next/previous page Adjusting the window...
Transforming Parent Functions
Tracing (changing x or y value)
menu 4: Trace click/enter to place point type value & hit enter
Dragging points along the function
Lists and Spreadsheets
spreadsheet function table
Filling column with arithmetic sequence Formula in "diamond" row
Note: Make sure to title column
What about the table that I used so much on my TI83/84?
Scatter Plot from Table
hit enter to choose variable New graph page & change type
In an empty cell in spreadsheet, choose menu 4: Statistics 1: Stat Calculations... choose X List and Y List
Statistics from Data
Notes (3 templates)
Data and Statistics
type in some values & highlight column (up arrow once at top) dynamically linked
Quick Graph
select layouts custom splits
More software (included/free)
Computer Link
http://education.ti.com