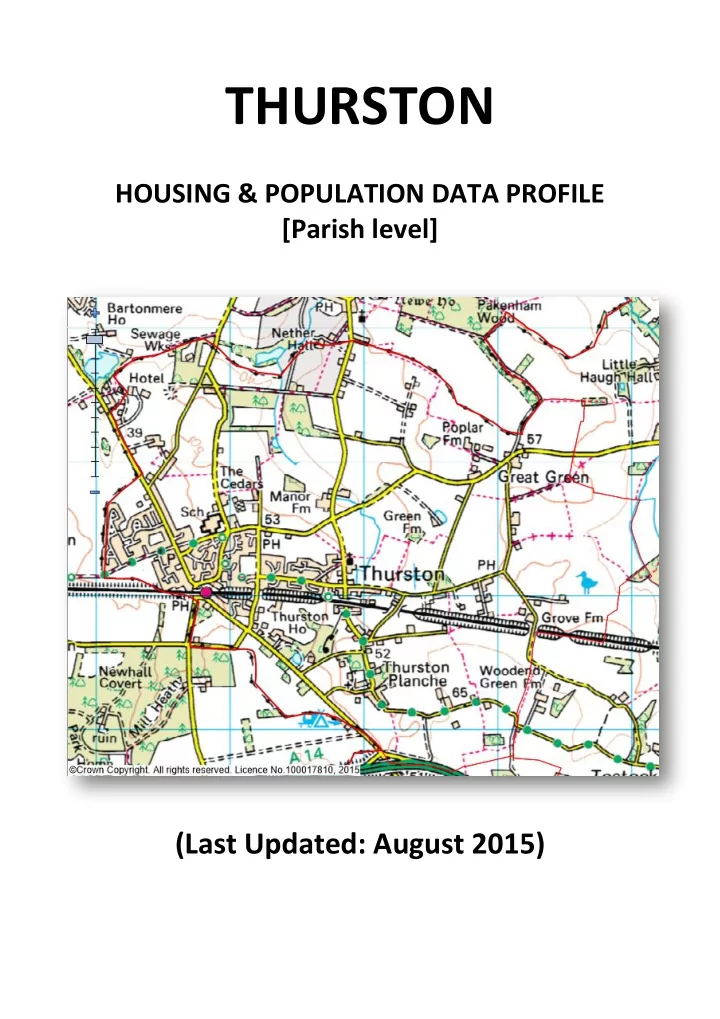

THURSTON HOUSING & POPULATION DATA PROFILE [Parish level] (Last Updated: August 2015)
This Parish Profile has been produced primarily to help inform local discussion on housing need. Most of the data comes from the 2011 Census (accessible via the ONS website). Other data sources have also been used as appropriate, and will be updated periodically. How many Children Working People Dependency people live Under Age Adults Aged Ratio locally? 16 (16 to 64) 65 + 3,232 605 (18.7%) 650 (20.1%) 0.63 1,977 (61.2%) 49.4% Males Mid Sflk Avg = 18.4% Mid Sflk Avg = 61.5% Mid Sflk Avg = 20.1% Mid Sflk Avg = 0.63 England Avg = 18.9% England Avg = 16.3% England Avg = 0.55 50.6% Females England Avg = 64.7% [Source: ONS 2011 Census: KS101EW & KS102EW] [Dependency Ratio = Ratio of Non-working Age to Working Age Population] Single Pensioner Single H/holds Lone Parent Families Households < 65 years old with Dependent Children 170 126 51 12.8% of all Households 9.5% of all Households 13.4% of all families with dependent children (Mid Suffolk Avg = 12.9%) (Mid Suffolk Avg = 12.4%) (Mid Suffolk Avg = 17.7%) (England Avg = 17.9%) (England Avg = 12.4%) (England avg = 24.5%) [Source: ONS 2011 Census: KS105EW] General Health (All Usual Residents) Very Good Good Fair Bad Very Bad 50.2% 35.8% 10.4% 2.8% 0.8% Mid Sflk Avg = 47.9% Mid Sflk Avg = 35.3% Mid Sflk Avg = 12.8% Mid Sflk Avg = 3.1% Mid Sflk Avg = 0.8% England Avg = 35.2% England Avg = 3.6% England Avg = 1.0% England Avg = 47.2% England Avg = 12.8% [Source: ONS 2011 Census: QS302EW] Total # Owned Shared Socially Privately Occupied (Outright or with Ownership Rented Rented Mortgage) Households 1,116 (84.1%) 21 (1.6%) 54 (4.1%) 116 (8.7%) 1,327 Mid Sflk Avg = 75.1% Mid Sflk Avg = 0.8% Mid Sflk Avg = 11.3% Mid Sflk Avg = 11.2% England Avg = 63.3% England Avg = 17.7% England Avg = 16.8% England Avg = 0.8% [Source: ONS 2011 Census: QS405EW] At the time of the 2011 Census some 28 dwellings (2.1% of all dwellings in Thurston) appeared to be unoccupied. (Mid Suffolk Avg = 3.8%) [QS418EW]
Number of Bedrooms (Occupied Households) None 1 bed 2 bed 3 bed 4 bed + 0 (0%) 34 (2.6%) 339 (25.5%) 528 (39.8%) 426 (32.1%) Mid Sflk Avg = 0.1% Mid Sflk Avg = 6.0% Mid Sflk Avg = 25.0% Mid Sflk Avg = 40.4% Mid Sflk Avg = 28.5% England Avg = 11.8% England Avg = 41.2% England Avg = 18.9% England Avg = 0.2% England Avg = 27.9% [Source: ONS 2011 Census: QS411EW] Total # Occupied Total # with Over- Total # with Under- Households Occupied bedrooms Occupied bedrooms 1,129 (85.1%) 11 (0.8%) 1,327 Mid Sflk Avg = 80.8% / England Avg = 68.7% Mid Sflk Avg = 1.6% / England Avg = 4.6% [Source: ONS 2011 Census: QS412EW] NET NEW RESIDENTIAL COMPLETIONS (Last 5 Years: April to March) 2010/11 2011/12 2012/13 2013/14 2014/15 3 22 3 8 9 [Source: Babergh & Mid Suffolk Joint Annual Monitoring Report] Avg Price & No (in brackets) of Properties Sold in IP31 Postcode (May 2015) Detached Semi-det Terraced Flat All £337,233 (15) £220,445 (10) £187,498 (2) £212,0000 (1) £280,355 (28) [Source: Right Move website: Market Trends] In Mid Suffolk, in 2014 ….the average wage was £2 6,301. The average house price was £203,220. Therefore, the wage to house price ratio = x 7.73 [Source: LGA website: http://100days.local.gov.uk/localised-data/
Other Information County Councillor = Cllr Penny Otton (Thedwastre South) District Councillor = Cllr Derrick Haley & Cllr Esther Jewson (Thurston & Hessett Ward) Thurston is identified as a Key Service Centre in Policy CS1 of the Mid Suffolk Core Strategy DPD (Adopted Sept 2008) Thurston Parish Council is preparing a Neighbourhood Plan . The first part of this process, an application to define the boundary of the NP area (the parish boundary), was approved by Mid Suffolk DC in September 2013. Local Services in Thurston include: a Primary & Upper School, Post Office / Grocery Store, Pub / Restaurant, Railway Station and Local Business Units 64.1% of all households with at least one usual resident in Thurston have access to gas central heating. A further 19.5% said that they used oil-fired heating and 8.7% said that they used electric heating. [QS415EW] The following Housing Association ’s (Registered Providers) are known to be active in Thurston: Flagship, Hastoe and Suffolk Housing Society The 2014 Suffolk Housing Survey shows that, across Mid Suffolk district: o 12% of all existing households contain someone looking for their own property over the next 3 years (mainly single adults without children). The types of properties they are interested in are flats / apartments, and smaller terraced or semi-detached houses. Although this is not their first preference, many accept that the private rented sector is their most realistic option. o 25% of households think their current property will not be suitable for their needs in 10 years’ time . o 2 & 3 bed properties are most sought after by existing households wishing to move. o Suitable housing options for more elderly people are less available within the current housing stock. 6% of all households have elderly relatives who may need to move to Suffolk within the next 3 years .
Recommend
More recommend