THE VES Key Indicators 2017-2018 Fall Transition Winter Transition - - PowerPoint PPT Presentation

the ves key indicators 2017 2018
SMART_READER_LITE
LIVE PREVIEW

THE VES Key Indicators 2017-2018 Fall Transition Winter Transition - - PowerPoint PPT Presentation

THE VES Key Indicators 2017-2018 Fall Transition Winter Transition Spring June 2018 Deficient 0 (0%) 11 (19%) 9 (15%) Emerging 0 (0%) 13 (22%) 5 (9%) Established 0 (0%) 35 (59%) 45 (76%) New Student 62 3 Unscored 0 3 Total Students 0 59


slide-1
SLIDE 1

THE VES Key Indicators 2017-2018

June 2018

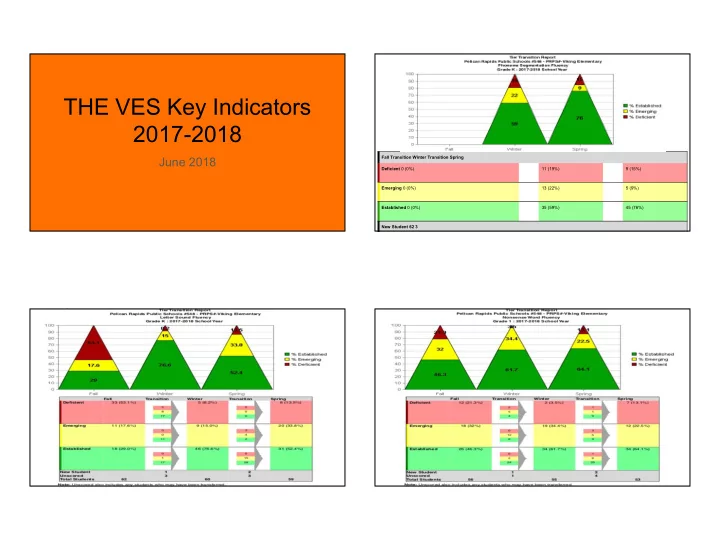
Fall Transition Winter Transition Spring Deficient 0 (0%) 11 (19%) 9 (15%) Emerging 0 (0%) 13 (22%) 5 (9%) Established 0 (0%) 35 (59%) 45 (76%) New Student 62 3 Unscored 0 3 Total Students 0 59 59

slide-2
SLIDE 2

STAR Reading Data (Spring 2018)

Grade Fall ‘17 Proficiency Spring ‘18 Proficiency 3rd 43.9% 60% 4th 40% 47% 5th 50% 46% 6th 43% 49%

School-wide WIG WIG

The students of THE Viking Elementary School will read 1,500,000 pages from October 1st to May 15th.

Result

Students read a total of 1,502,467 pages

STAR Math Data (Spring 2018)

Grade Fall ‘17 Proficiency Spring ‘18 Proficiency 3rd 53% 64% 4th 54% 77% 5th 51% 47% 6th 51% 65%

slide-3
SLIDE 3

AVMR

  • Advantage Math Recovery is a Math intervention focus on:
  • Forward Number Word Sequence
  • Backward Number Word Sequence
  • Number Identification
  • Structuring Numbers
  • Addition & Subtraction
  • Place Value
  • Multiplication & Division

AVMR Results

FNWS BNWS NID SN A/S K 90.3% 87.1% 74.2% 57.4%

  • 1st

89.5% 72.7% 80% 47.3% 61.8% 2nd 95.6% 86.8% 92.6% 47.1%

(32.4% at L4)

22.9%

(14.6% at L4)

ELL Proficiency (ACCESS)

★ 89% (80/91) of ELL students increased at least 1 Level from last school year (grades 1-6)

○ 100% (19/19) of 1st grade ELL student ○ 100% (13/13) of 5th grade ELL students

Service Learning Projects

❏ Canned Food Drive ❏ Pennies for Patience ❏ Pelican Valley Nursing Home visits