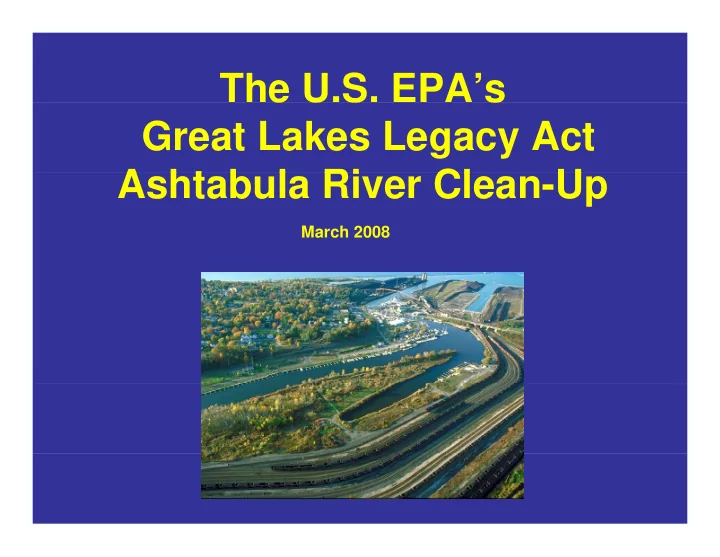
SLIDE 1 The U.S. EPA’s Great Lakes Legacy Act A ht b l Ri Cl U Ashtabula River Clean-Up
March 2008
SLIDE 2
1995 PCB Sampling Locations
SLIDE 3 Summary of Sampling Results
- 545,000 cubic yards of impacted
sediments
- Maximum PCB Concentration 660 ppm
- Average PCB Concentration: 7.5 ppm
(throughout entire sediment column)
- 25,000 pounds of PCBs present in
sediments
SLIDE 4 Baseline Sampling Program Baseline Sampling Program
– PCBs, HCB, HCBD, TOC , , ,
– 20-day for C. dilutus Survival and Growth 28 d f H t S i l d G th – 28-days for H. azteca Survival and Growth
– PCBs, TOC C , OC
- Whole Sediment Bioaccumulation
– 28-day exposure of Lumbriculus variegatus; – Analyzed for: PCBs, % Lipids, % Moisture
– 28-day exposure of young of the year catfish 28 day exposure of young of the year catfish – Analyzed for: PCBs, % Lipids, % Moisture
SLIDE 5 PCB SWAC PCB SWAC
Strong Brook Source
SLIDE 6 Baseline Sampling: Results and Lessons Learned
L L d
– Always do a baseline assessment – Always collect recent data to assess potential sources I ’ 2008 d h ill i l h – It’s 2008 and there are still violators out there (intentional and/or unintentional)
R lt
– Pre-Dredging PCB SWAC: 0.5 mg/kg
SLIDE 7
Project Details Project Details
SLIDE 8 Project Goals
– Reduce contaminant levels in fish – Restore use of river by boats
- 20% of boats damaged due to shallow depths in 2005
Reduce number of tumors in fish – Reduce number of tumors in fish – Restore valuable habitat
p
– 0.25 ppm PCBs Surface Weighted Average Concentration (SWAC) 10 years after the completion
– 7.5 ppm PCB SWAC immediately following dredging – Dredge navigation channel below the federally authorized depth
SLIDE 9
Re-Sedimentation and Recovery
SLIDE 10 Operations Overview
Containment Facility Dredge Booster Pump Water Treatment Dredging Operations Landside Booster Pumps Landside Booster Pumps
SLIDE 11
Dredging Dredging
SLIDE 12
Dredging Cross Section
SLIDE 13 Summary of Dredging Process y g g
A t t l t 11 f t – Average total cut = 11 feet – Range of cut depths = 2-18 feet Target depth: 20 feet or Bedrock – Target depth: 20 feet or Bedrock – 545,000 cubic yards targeted for removal
- Two Hydraulic Cutterhead Dredges
- Two Hydraulic Cutterhead Dredges
– 12” Dredge for Production 8” Dredge for Clean Up Passes – 8 Dredge for Clean Up Passes
- VicVac™ Suction attachment utilized for last pass
above bedrock in Upper Turning Basin
– Operated Concurrently
SLIDE 14
Hydraulic Dredge
SLIDE 15 Dredging Equipment g g q p
Biggest Challenge: Debris Solution: Gatling Plate and Shear Bar Solution: Root Knife Installed in Pumps
SLIDE 16 Dredging and Debris
Dredging and Debris
– 2006: 19% project downtime throughout the entire system, with the worst day averaging 4 h d h shutdowns per hour
- installed revised gatling plate, and root knife in
dredge pump led to 7% project downtime and 1 dredge pump led to 7% project downtime, and 1 cleanout every 2 hours.
– 2007: Installed wiper blade along with gatling p g g g plate, added root knives to all boosters
SLIDE 17
8” Dredge for Cleanup Operations Cleanup Operations
SLIDE 18
VicVac™ Attachment
SLIDE 19 Residual Contamination and Cover Layer y
Sand Cover Layer
SLIDE 20 Dredging Operation Details g g p
- 12” Dredge Operating Independently
– GPM = 4 000 – GPM = 4,000 – Average % Solids = 8%-10% – Cy/day = 1 200 to 5 000 (dependent on Cy/day 1,200 to 5,000 (dependent on system uptime) – Average cut depth per pass = 5 ft face g p p p
- 12” Dredge and 8” Dredge in Tandem
– GPM = 3,500 + 1,000 = 4,500 , , , – Average % Solids = 8% – Cy/day = 1,200 to 5,000 (dependent on system uptime)
SLIDE 21 Dredging Operation Details g g p
- 8” Dredge with VicVac™ Attachment
– GPM = 1,000 – Average % Solids = 2% to 4% g – Coverage = ½ acre/day – Average cut depth per pass = 6”-12” g p p p
SLIDE 22 Post-Dredging PCB Concentrations g g
Goal 1: 7.5 ppm immediately following dredging Goal 2: 0.25 ppm 10 years after dredging
SLIDE 23 Post-Dredging PCB Concentrations g g
Goal 1: 7.5 ppm immediately following dredging Goal 2: 0.25 ppm 10 years after dredging
SLIDE 24 Post Dredging SWAC
edg g S C
– Max. Concentration of 40 ppm
Max Concentration 33 ppm – Max. Concentration 33 ppm
SLIDE 25 Post-Dredging PCB Concentrations Post Dredging PCB Concentrations
Cleanup Dredging Area Dredging + MNR p g g Dredging + MNR Dredging + MNR
SLIDE 26 SWAC Comparison
Cl D d i A MNR A Cleanup Dredging Areas vs. MNR Areas
– Goal: Dredge to prescribed depth, natural sedimentation to complete remediation A i t A 18 – Approximate Area = 18 acres – # of Samples = 50 Post Dredge PCB SWAC = 3 7 ppm – Post-Dredge PCB SWAC = 3.7 ppm
- Cleanup Dredging Areas with 8” Dredge
Goal Remo e all sediment to bedrock – Goal: Remove all sediment to bedrock – Approximate Area = 10 acres # of Samples = 21 – # of Samples = 21 – Post-Dredge PCB SWAC = 0.1 ppm
SLIDE 27 Dredging: Lessons Learned
- Innovations are improving results of
environmental dredging “N it i th th f i ti ”
- “Necessity is the mother of invention”
- Use of wiper blades, gatling plate, and root
knives reduced impact of debris knives reduced impact of debris
- Need top notch team/Listen to the dredging
experts p
- Prescribe objectives, not methods
- Continuous improvement
p
- Proper sampling leads to accurate volume
estimates
- Set realistic cleanup goals
SLIDE 28
Transport, Dewatering, Disposal, Water Treatment
SLIDE 29
Double-Walled Pipeline
SLIDE 30 December 2005 December 2005 CF with geotube bags laid out in preparation for sediment dewatering August 2006 August 2006
SLIDE 31 Summary of Dewatering & Water Treatment
– Primary Treatment
- Geotubes (primary removal)
– Anionic and cationic polymers
– Secondary Treatment Secondary Treatment
- Lamella Settlers/Polishing Bag Field
– Poly Aluminum Chloride (PAC)
– Polishing Treatment
- Sand Filters
- Carbon Filters
- Carbon Filters
- Capacity
Designed for 5 000 gpm – Designed for 5,000 gpm
SLIDE 32 Summary of Water Treatment
g
– PCBs = 0.0001 ug/L (monthly average) – Hg = ND (at 0.16 ng/L) g ( g )
- Difficulty meeting this limit
- Discharge concentration significantly less than
river water concentrations
– TSS = 10 mg/L (monthly average)
SLIDE 33
Sediment Dewatering
SLIDE 34
Mountains of Bags g
SLIDE 35
Polymer Quality Control
SLIDE 36
Sand and Carbon Filter Units
SLIDE 37 Clarification System
(installed winter shutdown) (installed winter shutdown)
SLIDE 38
Polishing Bag Field Polishing Bag Field
SLIDE 39 Dewatering: Lessons Learned g
- Chemistry, Chemistry, Chemistry
- Accurate chemistry = better performance
- Accurate chemistry = better performance
– Not enough polymer = Poor solids removal – Too much polymer = Plugged bags & Unhappy WTP Too much polymer Plugged bags & Unhappy WTP – Heterogeneity of Sediment Slurry (% solids) – Oil and Grease
- Minimal Breakages (9 bag failures)
– Watch flow rates and pressures
- Adequate man power, lighting, training, and
conditioning
- Safety/Managing bags for stability
SLIDE 40 Water Treatment: Lessons Learned
- Getting the Chemistry Right
– Substantial problems if chemistry and dose of Substantial problems if chemistry and dose of polymer not accurately matched to sediment chemistry S di t t h t i – Sediments are not a homogeneous matrix
- Impacts from Oxidation of Iron
B f d/ ft t t t l t – Before and/or after treatment plant
- Need enough flexibility to incorporate changes
to WTP as required to WTP as required
– Equipment – Size Size
SLIDE 41
Progress, Issues, and Modifications
SLIDE 42 2006 Progress
- Dredging Commenced on September 9,
2006 2006
– Average production <800 cy per day – 62,000 cubic yards dredged , y g – Winter shutdown on November 27, 2006
Barrier to Construction
– Polymer chemistry/dosing – Water treatment plant performance p p
– Debris
SLIDE 43 Winter 2006/2007 Modifications
- Root knives installed on dredge and at each booster
pump G
- Installed Wipers on Gatling Plate
- Secondary treatment component added to WTP
– Lamella settlers – Polish bag field
- Modifications to dewatering/water treatment chemistry
Cationic polymer added prior to dewatering – Cationic polymer added prior to dewatering – ACH added to control soluble iron before primary treatment process
- 2nd 8” Dredge mobilized for cleanup operations
- 2nd 8 Dredge mobilized for cleanup operations
– Articulating dredge head – VicVac™ Attachment 12” D d d 8” D d f d i t i l 12” t t li – 12” Dredge and 8” Dredge feed into single 12” transport line
SLIDE 44 2007 Progress
- Full-scale dredging commenced April 6,
2007 2007
– Average production ~2,400 cy per day (including cleanup passes) at ~63% project uptime – 435,000 cubic yards dredged in 2007 D d i d d t O t b 14 2007 – Dredging end date: October 14, 2007
– 2+ acres covered in 7 days
SLIDE 45 Lessons Learned
- Initial production ≠ Ultimate Production
- 2007 performance improvements was
- 2007 performance improvements was
possible because of lessons learned during 3 month production-scale “pilot” dredging in 3 month production scale pilot dredging in 2006
Adapt and improve
- Dredging and disposal is not cheap ($125
per cubic yard) per cubic yard)
- Dredging and disposal is not easy, but it
can be accomplished can be accomplished
SLIDE 46
Questions? Questions?