The Rapid Growth of Goods The Rapid Growth of Goods Movement- - - PDF document

the rapid growth of goods the rapid growth of goods
SMART_READER_LITE
LIVE PREVIEW

The Rapid Growth of Goods The Rapid Growth of Goods Movement- - - PDF document

Global Freight Energy Use The Rapid Growth of Goods The Rapid Growth of Goods Movement- -Related Emissions Related Emissions Movement MTOE 1200 Worldwide: Trends, Health Effects Worldwide: Trends, Health Effects Water Rail Truck 1000


slide-1
SLIDE 1

Michael P. Walsh 1 The Rapid Growth of Goods The Rapid Growth of Goods Movement Movement-

  • Related Emissions

Related Emissions Worldwide: Trends, Health Effects Worldwide: Trends, Health Effects and Needed Policy Responses and Needed Policy Responses

Healthy Regions, Healthy Healthy Regions, Healthy People People October 17, 2005 October 17, 2005

Michael P. Walsh Michael P. Walsh International Consultant International Consultant

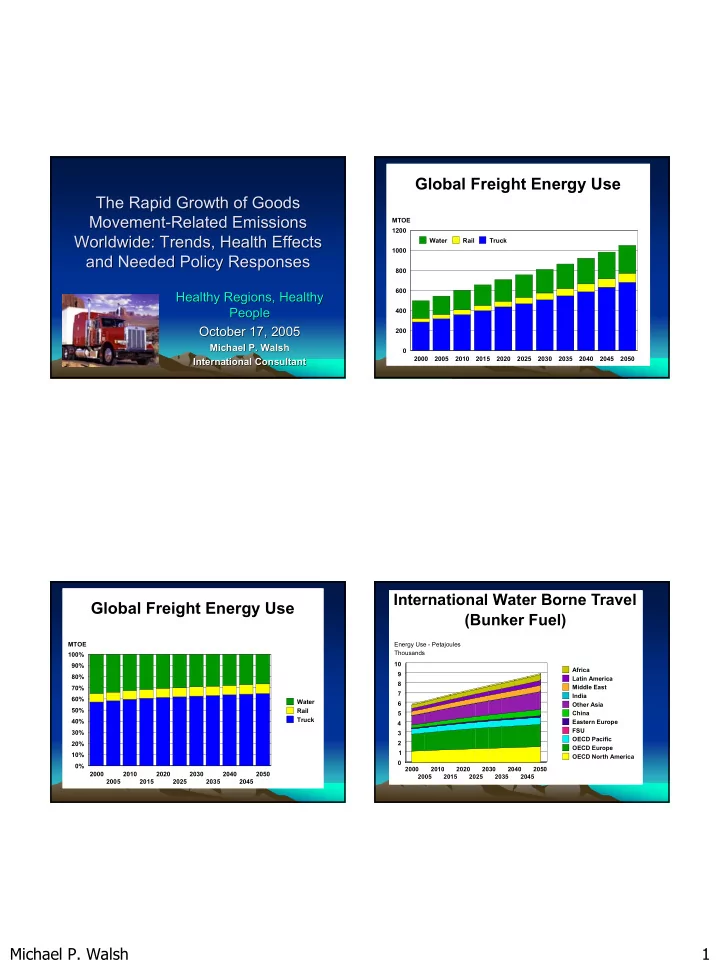
2000 2005 2010 2015 2020 2025 2030 2035 2040 2045 2050 200 400 600 800 1000 1200 MTOE Water Rail Truck

Global Freight Energy Use

2000 2005 2010 2015 2020 2025 2030 2035 2040 2045 2050 0% 10% 20% 30% 40% 50% 60% 70% 80% 90% 100% MTOE Water Rail Truck

Global Freight Energy Use

2000 2005 2010 2015 2020 2025 2030 2035 2040 2045 2050 1 2 3 4 5 6 7 8 9 10 Thousands Energy Use - Petajoules Africa Latin America Middle East India Other Asia China Eastern Europe FSU OECD Pacific OECD Europe OECD North America

International Water Borne Travel (Bunker Fuel)

slide-2
SLIDE 2

Michael P. Walsh 2

Ö Ölschlieren lschlieren

slide-3
SLIDE 3

Michael P. Walsh 3

A v e r a g e R e f i n e r y A v e r a g e P

  • w

e r P l a n t . 5 M i l l i

  • n

C a r s P

  • r

t

  • f

V i r g i n i a P

  • r

t

  • f

N Y / N J P

  • r

t

  • f

L A

5 10 15 20 25 30 35

NOx Emissions

Tons per day

A v e r a g e R e f i n e r y A v e r a g e P

  • w

e r P l a n . 5 M i l l i

  • n

C a r s P

  • r

t

  • f

V i r g i n i a P

  • r

t

  • f

N Y / N J P

  • r

t

  • f

L A

0.5 1 1.5 2 Source: NRDC "Harboring Pollution"

PM10 Emissions

Tons per day

Pollution From Ports Compared To Other Sources

MARPOL Agreement MARPOL Agreement

  • Annex VI Entered Into

Force on 19 May

  • Global cap of 4.5% Sulfur
  • Special SOx Control

Areas Limited to 1.5% or SOx limits

– Baltic Sea – North Sea

  • Ozone Depleting

Substances

  • NOx Limits
  • Restricts PCB

Incineration

Key Elements of Current Marine Diesel Program

(only applies to U.S. vessels)

2002 2004 2006 2008 2010

Recreational

(30%/25% NOx/PM ↓ )

<50 hp

(40%NOx/PM ↓)

Commercial

(30%/25% NOx/PM ↓) 2000 Tier 1 2014 2012 15 ppm 500 ppm S fuel

Marine diesel fuel

1998 Tier 2 Tier 1 Tier 2

  • nly for >2.5 liter/cylinder

(voluntary in 2000-2003)

Tier 2

2000 2005 2010 2015 2020 2025 2030 2035 2040 2045 2050 1 2 3 4 Thousands Energy Use - Petajoules Africa Latin America Middle East India Other Asia China Eastern Europe FSU OECD Pacific OECD Europe OECD North America

Rail Freight Movement

slide-4
SLIDE 4

Michael P. Walsh 4

Key Elements of Current Locomotive Program

(only applies to U.S. railroads)

2002 2004 2006 2008 2010

Tier 2

(60/50% NOx/PM ↓ )

Tier 0

(35% NOx ↓)

Tier 1

(50% NOx ↓) 2000 new-built in 2001 rebuilds of locomotives built in 1973-2001 new-built in 2002-2004 new-built in 2005+ 2014 2012 15 ppm 500 ppm S fuel

Locomotive diesel fuel

Trucks 1991 1998 2004

0.1 0.2 0.3 0.4 0.5 0.6 0.7 0.8 0.9 1.0 1 2 3 4 5 6 7 8 9 10

NOx (g/hp-hr) PM (g/hp-hr)

Current Locomotive/Marine Diesels Standards are Comparable to Early 1990’s Diesel Truck Standards

Locomotives Tier 2 2005 Marine Tier 2 2004-2009 Trucks 2010

EPA Regulatory Development Priority EPA Regulatory Development Priority -

  • Diesel Locomotive & Marine Engines

Diesel Locomotive & Marine Engines

EPA requires 15ppm sulfur in fuel for loco/marine in 2012 EPA Engine proposal targeted for the spring of 2006

2000 2005 2010 2015 2020 2025 2030 2035 2040 2045 2050 0% 10% 20% 30% 40% 50% 60% 70% 80% 90% 100% MTOE Water Rail Truck

Global Freight Energy Use

slide-5
SLIDE 5

Michael P. Walsh 5 NO NOx

x emissions

emissions

EU EU-

  • 25

25

Power generation Power generation Industrial combustion Industrial combustion Industrial processes Industrial processes Domestic Domestic Gasoline cars Gasoline cars Diesel cars Diesel cars Off-road Diesel heavy duty veh. Diesel heavy duty veh. Off-road

0% 25% 50% 75% 100% 2000 2020

Contribution to primary PM2.5 Contribution to primary PM2.5 emissions emissions

EU EU-

  • 15

15

Industrial combustion Industrial combustion Industrial processes Industrial processes Diesel exhaust, cars Diesel exhaust, cars Diesel exhaust, HDT Non-exhaust Non-exhaust Off-road Off-road Agriculture Agriculture Domestic, wood stoves Domestic, wood stoves

0% 25% 50% 75% 100% 2000 2020

Proximity To Truck Traffic Linked To Lung Proximity To Truck Traffic Linked To Lung Function in Children Function in Children

1,860 1,920 1,980 2,040 2,100 7500 12500 17500 22500

Truck Traffic Density

Lung Function in liter FEV1 Brunekreef, Epidemiology 1997; 8: 298-303

Typical engine exhaust mass and number Typical engine exhaust mass and number weighted size distributions shown with weighted size distributions shown with alveolar deposition alveolar deposition

0.02 0.04 0.06 0.08 0.1 0.12 0.14 0.16 0.18 0.2

0.001 0.010 0.100 1.000 10.000 Diameter (µm) Normalized Concentration, dC/Ctotal/dlogDp

0.1 0.2 0.3 0.4 0.5 0.6 0.7 0.8 0.9 1

Alveolar Deposition Fraction Mass Weighting Number Weighting Alveolar Deposition Fraction Fine Particles Ultrafine Particles Dp < 100 nm Nanoparticles Dp < 50 nm Nuclei Mode Accumulation Mode Coarse Mode PM10 Dp < 10 µm

Fractional deposition of particle with density of 1 g/um

slide-6
SLIDE 6

Michael P. Walsh 6

Comparison of PM10, PM2.5, Comparison of PM10, PM2.5, and Ultrafine PM and Ultrafine PM

PM10 PM10 (10 (10 µ µm) m) PM2.5 PM2.5 (2.5 (2.5 µ µm) m) Ultrafine PM Ultrafine PM (0.1 (0.1 µ µm) m)

Human Hair (60 µm diameter)

PM2.5 PM2.5 (2.5 (2.5 µ µm) m) PM10 PM10 (10 (10 µ µm) m)

Relative size of particles

Gasoline and LPG G-DI Conventional Diesel

Comparison of Particle Emissions from SMPS.7: All Vehicles and Fuels - 50kph

1.00E+06 1.00E+07 1.00E+08 1.00E+09 1.00E+10 1.00E+11 1.00E+12 1.00E+13 1 10 100 1000 Electrical Mobility Diameter/nm log scale [Particles/km] Conventional Diesels Direct Injection Gasoline Trap Equipped Diesels MPI and LPG Gasoline

Evolution of US On Evolution of US On-

  • Highway

Highway Heavy Duty Standards Heavy Duty Standards

0.01 0.01 0.10 0.10 0.2 0.2 1.2 1.2 2.5 2.5 4.0 4.0 5.0 5.0

1994 1998 2002 2007 2010 NOx NOx [g/HP

[g/HP-

  • hr]

hr]

PM PM [g/HP

[g/HP-

  • hr]

hr]

ULSD ULSD 15 PPM 15 PPM

(6/07)

500 PPM 500 PPM

(6/93)

SULFUR SULFUR

0 0.27 1 2 3 4 0.20 0.15 0.10 0.05

  • EURO4’05

■ EURO5 ’08 US’04 ▲ (NOx+HC) US 2010 ▲

HD Diesel NOx and PM Emissions Regulations HD Diesel NOx and PM Emissions HD Diesel NOx and PM Emissions Regulations Regulations

NOx g/kWh PM g/kWh

Japan’03 Japan’05 ▲ US’07 0.013 Japan’09

slide-7
SLIDE 7

Michael P. Walsh 7

500 1000 1500 2000 2500 3000 3500 PPM Fuel Sulfur 0.01 0.02 0.03 0.04 0.05 0.06 grams/kilometer PM Emissions Other PM Sulfur

Linkage Between Fuel Sulfur and Linkage Between Fuel Sulfur and PM Emissions PM Emissions

Oxidation Catalyst PM Filter Figure 2 -- Major Commercial Truck Markets

200 400 600 800 1000 1200 Total Truck Market Volume (000s)

1999 2004 CHINA INDIA EUROPE NAFTA NAFTA EUROPE INDIA

Heavy Duty Diesel PM Regulations 2010

US 91/Euro 1 or less US94/Euro 2 US98/Euro 3 US 04/Euro 4 US 07/Euro 5 US 10/Euro 6

Heavy Duty Diesel PM Regulations 2015

US 91/Euro 1 or less US94/Euro 2 US98/Euro 3 US 04/Euro 4 US 07/Euro 5 US 10/Euro 6

slide-8
SLIDE 8

Michael P. Walsh 8

Above 500

23.4%

500

38.9%

350

1.8%

50

29.9%

10/15

5.9%

2005

Total: 581,872

Above 500

16.6%

500

18.0%

350

1.8%

50

6.4%

10/15

57.2%

2008

Total: 624,319

Above 500

16.5%

500

14.0%

350

3.0%

50

7.6%

10/15

58.8%

2010

Total: 652,591

Above 500

7.9%

500

10.0%

50

20.2%

10/15

61.8%

2010 Aggressive

Total: 652,591

Global Distribution of On Road Diesel Fuel Sulfur Content (PPM)

No Controls 20.0% Engine Modifications 2.3% US 91/Euro 1 13.3% US94/Euro 2 20.3% US98/Euro 3 3.8% US 04/Euro 4 40.3%

2005

No Controls 18.8% Engine Modifications 2.3% US 91/Euro 1 0.9% US94/Euro 2 24.3% US98/Euro 3 6.8% US 04/Euro 4 5.8% US 07/Euro 5 30.7% US 10/Euro 6 10.4%

2010

No Controls 17.0% Engine Modifications 0.6% US 91/Euro 1 0.0% US94/Euro 2 0.4% US98/Euro 3 12.5% US 04/Euro 4 21.6% US 07/Euro 5 4.3% US 10/Euro 6 43.6%

2015

Global Distribution of Emissions Controls New Heavy Duty Diesel Trucks (000)

2000 2005 2010 2015 2020 2025 2030 2035 2040 2045 2050 0.2 0.3 0.4 0.5 0.6 0.7 0.8 0.9 1 1.1 Normalized to 2000 NOx PM

Heavy Duty Diesel Vehicle Emissions Trends

Cumulative Emissions By Age Cumulative Emissions By Age – – Diesel Trucks Diesel Trucks

0.1 0.2 0.3 0.4 0.5 0.6 0.7 0.8 0.9 1

4 + 3 8 3 6 3 4 3 2 3 2 8 2 6 2 4 2 2 2 1 8 1 6 1 4 1 2 1 8 6 4 2

Vehicle Age Cummulative Emissions

PM NOx

slide-9
SLIDE 9

Michael P. Walsh 9

General Regulatory Approach General Regulatory Approach

  • Retrofit mid-aged engines

– Filters 85% PM – Catalysts 25% PM – Other 50% PM typical

  • Replace older engines

– Re-power – New vehicle

CA Verified Devices and CA Verified Devices and Applications Applications

Off 1994-2002 25 1 Ox catalyst Off 1996-2002 20 50 1 Fuel+ox cat. Off 1996-2004 85 1 Filter On 1991-1998 25-80 25 2 Ox catalyst On 1973-2003 25 2 Ox catalyst On 1996-2002 15 50 2 Fuel On 1991-1993 50 1 Filter On 1993-2003 25-40 85 3 Filter On 1994-2004 85 5 Filter

On/off

Years1

NOx PM

#1 Type

7/05

1 Individual devices may have a more limited model year application

EPA Funded Retrofit Projects

Conclusions Conclusions

  • Emissions From Heavy Duty Diesel Are A Major Source
  • f PM and NOx Emissions
  • Standards in US/EU/Japan Converging at Very Low

Levels but Differing Technology Options May Emerge

– EU Diesel NOx Standards Will Still Likely Lag After Euro 5 and Euro 6 – Ultrafines Still Issue Without PM Filters

  • Major Challenges

– Increasing Adoption of Low Sulfur Fuel in Developing Countries – Accelerating The Introduction of Euro 3, 4 and 5 in Developing Countries – Addressing Locomotives and Marine Vehicles – Retrofitting and Replacing Existing Dirty Engines