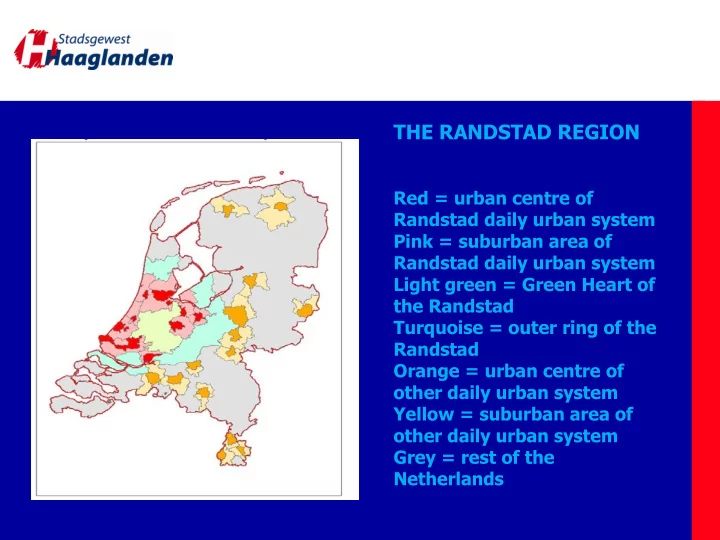
the randstad region
play

THE RANDSTAD REGION Red = urban centre of Randstad daily urban - PowerPoint PPT Presentation

THE RANDSTAD REGION Red = urban centre of Randstad daily urban system Pink = suburban area of Randstad daily urban system Light green = Green Heart of the Randstad Turquoise = outer ring of the Randstad Orange = urban centre of other daily


  1. THE RANDSTAD REGION Red = urban centre of Randstad daily urban system Pink = suburban area of Randstad daily urban system Light green = Green Heart of the Randstad Turquoise = outer ring of the Randstad Orange = urban centre of other daily urban system Yellow = suburban area of other daily urban system Grey = rest of the Netherlands

  2. The Randstad Region in 60 years

  3. The balance between urban and peri urban

  4. The challenges of being a region in a low country

Download Presentation
Download Policy: The content available on the website is offered to you 'AS IS' for your personal information and use only. It cannot be commercialized, licensed, or distributed on other websites without prior consent from the author. To download a presentation, simply click this link. If you encounter any difficulties during the download process, it's possible that the publisher has removed the file from their server.

Recommend


More recommend