
SLIDE 1
The potential of shoreface nourishments for habitat enhancement A - - PowerPoint PPT Presentation
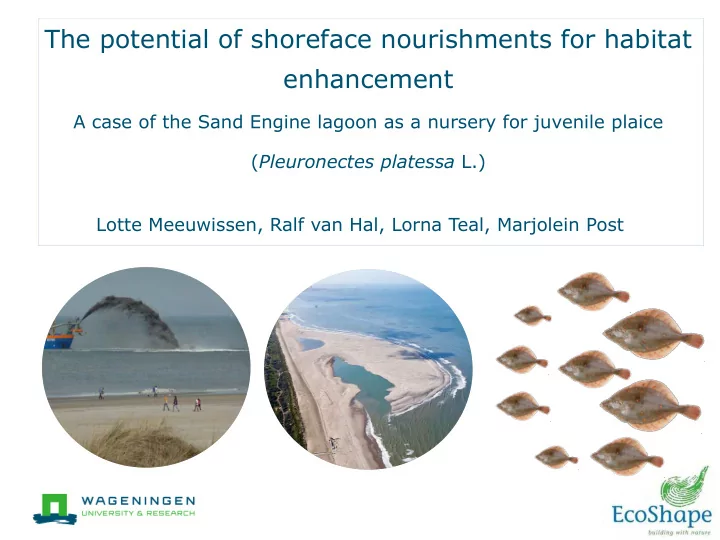
The potential of shoreface nourishments for habitat enhancement A case of the Sand Engine lagoon as a nursery for juvenile plaice ( Pleuronectes platessa L.) Lotte Meeuwissen, Ralf van Hal, Lorna Teal, Marjolein Post Sand engine; mega
The Netherlands: Ter Heijde
Lagoon Lagoon Lagoon
October 13, 2011 May 14 , 2012 July 1 , 2013
Lagoon Lagoon Lagoon
Growth (cm day -1) Temperature (°C) 5 10 15 20 25 30 0.00 0.05 0.10 0.15
Temperature (°C)
40 cm 25 cm 10 cm (Teal et al., 2010)
Every 2 weeks: 2012: end of April – end of August 2013: mid May – mid August 2 m beam trawl Mesh size: 1 and 2 cm Depth: 1.5-3 m and 4-5 m 1-3 trawls Distance and time Temperature Numbers and length of 0-group plaice à predominant flatfish species
al., 2012)
Growth and DEB: only lagoon and area South 2012 compared
Difference in axes!
Lagoon: Peak in growth rate South: Increasing growth rate
Lagoon: Observed growth lower than predicted growth South: Observed and predicted growth more equal
Meeuwissen, L., van Hal, R., Teal, L., Post, M.H.M., 2017, Journal of Sea Research, In review The potential of shoreface nourishments for habitat enhancement: a case of the Sand Engine lagoon as a nursery for juvenile plaice (Pleuronectes platessa L.) Contact: lottemeeuwissen@live.nl
Still looking for a job ;-)
16
Species Lagoon South North Far South Plaice (Pleuronectes platessa) Sole (Solea solea) Turbot (Scophthalmus maximus) Dab (Limanda limanda) Common shrimp (Crangon crangon) Goby species (Pomatoschistus species) Sprat (Sprattus sprattus) 2012 2013 2012 2013 2012 2013 2013 325
459 100 6 84
35 3 52 4 5 3 304 94 33 113 1 6 5 5795 395
1 3
34 17 12 4 5 3 7833 188 1 49 1 5 3 5888 5336 4
Total numbers per species caught per sampled area in 2012 and 2013.
July 2017
The average seawater surface temperature (°C) of the trawls for every date in each sampling area in 2012 (solid black lines) and 2013 (grey dotted lines).
Sampling area Mesh size Depth 24- April 2- May 23- May 7- June 20- June 26- June 27- July 10- Aug 29- Aug Lagoon 1 cm 1.5-3 m 1 2 1 1
4-5 m 1 1 1
1 cm 1.5-3 m 1 2 2 2 1
4-5 m 1 2 2 2 1
1 cm 1.5-3 m 1 1 2 2 1
3.5-4.5
2 cm 1.5-3.5 m
2 1 1 2 5 2 cm 3-4 m
2 cm 4-5 m
1 2 2 South 2 cm 1.5-3.5 m
3 2 3
4-5.5 m
2 2 2
2 cm 1.5-3.5 m
1 2 1
3.5-4.5 m
5 9 8 10 10 9 8 10 10 The number of performed trawls per sampling area per day with corresponding depth and used mesh size of the beam trawl in 2012.
Sampling area Mesh size Depth 16-May 28-May 11- June 2- July 17-July 23-July 20-Aug Lagoon 1 cm 1.5-3 m
1 1 1 cm 4-5 m 1 1
1 1 1 Far south 1 cm 1.5-3 m 1 1 1 1 1 1 1 1 cm 4-5 m 1 1 1 1 1 1 1 South 1 cm 1.5-3 m 1 2 1 1 1 1 1 1 cm 4-5 m 1 1 1 1 1 1 1 North 1 cm 1.5-3 m 1 1 1 1 1 1 1 Lagoon 2 cm 1.5-3 m 1 1 1 1 2 1 1 2 cm 4-5 m 1 1 1 1 1 1 1 Far south 2 cm 1.5-3 m 1
1 1 1 1 2 cm 4-5 m 1 2 1 1 1 1 1 South 2 cm 1.5-3 m 1
1 1 1 1 2 cm 4-5 m 1 1 1 1 1 1 1 North 2 cm 1.5-3 m 2 1 1 1 1 1 1 2 cm 4-5 m
14 14 13 13 16 14 14 The number of performed trawls per sampling area per day with corresponding depth and used mesh size of the beam trawl in 2013.
21
22
!" !# = &' ṗ
)* +, -./0 1[3*]× 678
9: 9;<=19: 9
" &' >? @[>A]
H
H
HN
HN
HO
HO
HN
HN
HO
HO