The p-n Junction ELEG620: Solar Electric Systems University of - - PowerPoint PPT Presentation

the p n junction
SMART_READER_LITE
LIVE PREVIEW

The p-n Junction ELEG620: Solar Electric Systems University of - - PowerPoint PPT Presentation

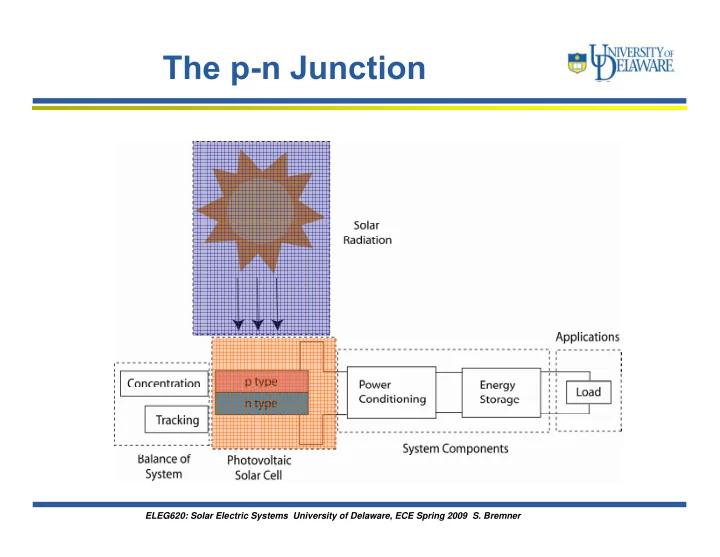
The p-n Junction ELEG620: Solar Electric Systems University of Delaware, ECE Spring 2009 S. Bremner The pn Junction The pn Junction in Equilibrium Built in voltage Carrier concentrations Depletion Region The pn


slide-1
SLIDE 1

ELEG620: Solar Electric Systems University of Delaware, ECE Spring 2009 S. Bremner

The p-n Junction

slide-2
SLIDE 2

ELEG620: Solar Electric Systems University of Delaware, ECE Spring 2009 S. Bremner

The pn Junction

  • The pn Junction in Equilibrium

– Built in voltage – Carrier concentrations – Depletion Region

  • The pn Junction Under Bias

– Carrier Injection

  • IV equation for pn junction

– Minority carrier current in quasi-neutral regions – Current flow in depletion region – Physical Meaning of I0 – Reverse breakdown

  • Quasi-Fermi Levels
  • Non-idealities

– Series resistance – High Injection – Depletion Region Recombination

slide-3
SLIDE 3

ELEG620: Solar Electric Systems University of Delaware, ECE Spring 2009 S. Bremner

pn Junction in Equilibrium

  • Bring p type and n type material together physically
  • Thermal equilibrium means no extra heat, no applied voltages, no

light

  • The electrons from the n type material will diffuse into the p type

material (and vice versa for holes)

  • After crossing the junction the electrons in the p type (holes in n

type) material are minority carriers with a recombination lifetime

  • Keep in mind the dopant atoms don’t move – they are part of the

crystal

slide-4
SLIDE 4

ELEG620: Solar Electric Systems University of Delaware, ECE Spring 2009 S. Bremner

pn Junction in Equilibrium

  • Movement of carriers across junction leaves ionized dopant atoms

behind

  • Material is now charged since the balancing charge carrier is gone
  • Electric field is now present around the junction
  • Region around the junction is called the space charge region or

more commonly the depletion region (since the region surrounding the junction is depleted of carriers)

Note: remember Electric field direction is defined for a positive charge

slide-5
SLIDE 5

ELEG620: Solar Electric Systems University of Delaware, ECE Spring 2009 S. Bremner

pn Junction in Equilibrium

  • This is a drift current – the E field sweeps holes in n type material to

the p type material (minority to majority carriers) and vice versa

  • Unless the minority carrier concentration is increased somehow

(heat, optical generation, carrier injection) the drift current will remain low (more on this later)

  • Under Equilibrium the nett current is zero i.e. the drift current equals

the diffusion current

Note: remember Electric field direction is defined for a positive charge

slide-6
SLIDE 6

ELEG620: Solar Electric Systems University of Delaware, ECE Spring 2009 S. Bremner

pn Junction in Equilibrium

  • For a system in equilibrium the

average energy must be constant (obvious). This also means the Fermi level must be constant

  • Away from the junction the
  • riginal bulk conditions dominate

and so the band diagram is unaffected

  • Close to the junction the bends

bend due to the constant Fermi level, with the bending indicating the strength of the electric field

Separate Junction

slide-7
SLIDE 7

ELEG620: Solar Electric Systems University of Delaware, ECE Spring 2009 S. Bremner

Built-in Voltage

  • The electric field across the pn

junction means a built-in voltage Ψ0 is present

  • Don’t bother trying to measure it

with voltmeter, you can’t

  • Built-in voltage is given by the

difference between the Fermi levels

  • f the p and n type material
  • Use previously given expressions

for carrier concentrations to find expression in terms of doping levels

slide-8
SLIDE 8

ELEG620: Solar Electric Systems University of Delaware, ECE Spring 2009 S. Bremner

Carrier Conc. Under ≡rm

  • Away from the depletion region the

carrier concentrations are unaffected

  • Energy difference between Fermi

level and conduction (valence) band edge gives electron (hole) concentration – can sketch carrier concentration from band diagram

  • Recall the built-in voltage depends on

the doping – so we can relate carrier concentrations to the built-in voltage and each other

slide-9
SLIDE 9

ELEG620: Solar Electric Systems University of Delaware, ECE Spring 2009 S. Bremner

The Depletion Region

  • Depletion region surround pn junction

where carriers have diffused out leaving the ionized dopant atoms

  • Tails off exponentially away from the

junction – assuming that it vanishes at some distance from the junction, the deplation region approximation, helps simplify things greatly

  • For constant doping, depletion region

approximation means charge density in depletion region is constant (though different on each side of the junction) and zero outside of depletion region

  • The total amount of charge on either side
  • f the junction in the depletion region

must be equal

slide-10
SLIDE 10

ELEG620: Solar Electric Systems University of Delaware, ECE Spring 2009 S. Bremner

Depletion Region Width

  • We can find the depletion region width by

integrating the charge density over the region to get the electric field

  • The electric field can then be integrated

across the region to obtain the built-in voltage

  • We already know the built-in voltage in

terms of Fermi levels and so we can get the maximum electric field:

slide-11
SLIDE 11

ELEG620: Solar Electric Systems University of Delaware, ECE Spring 2009 S. Bremner

Depletion Region Width

  • Depletion region width is found to be:

With the two lengths either side of the junction given by: Maximum electric field increases with doping and is determined primarily by the lower level of doping The lower level of doping has the largest effect

  • n the depletion region width
slide-12
SLIDE 12

ELEG620: Solar Electric Systems University of Delaware, ECE Spring 2009 S. Bremner

pn Junction Under Bias

  • Forward bias is a voltage applied to the pn junction that REDUCES the electric

field at the barrier, Reverse bias INCREASES the electric field at the junction

  • When bias is applied the balance between drift and diffusion current is destroyed

– nett current flow

  • In forward bias, drift current decreases very slightly (can assume it stays the

same) but diffusion current increases – Nett current flow

  • In reverse bias opposite
  • ccurs with diffusion

current decreasing and drift remaining same – Nett current flow (this

  • ne isvery small)
slide-13
SLIDE 13

ELEG620: Solar Electric Systems University of Delaware, ECE Spring 2009 S. Bremner

pn Junction Under Bias

  • Band diagram summary of the three types of bias possible

Equilibrium Forward Bias Reverse Bias

Nett current

+ve

  • ve
slide-14
SLIDE 14

ELEG620: Solar Electric Systems University of Delaware, ECE Spring 2009 S. Bremner

Depletion Region Under Bias

  • Since the applied bias changes the electric field at the junction we can

expect the depletion region width to also be changed

  • Assume that the voltage drop is only across the depletion region then

for applied bias Va we have

  • This will also affect the depletion region width
  • Forward bias decreases the depletion region width whilst reverse bias

increases it

slide-15
SLIDE 15

ELEG620: Solar Electric Systems University of Delaware, ECE Spring 2009 S. Bremner

Carrier Injection

  • In forward bias the barrier to diffusion current is reduced and so more

carriers diffuse across junction from where they are a majority carrier to where they are a minority carrier – minority carrier populations increase

  • We can think of this process as carriers being injected from one side of

the depletion region to the other – “carrier injection”

  • In the absence of generation

the concnetration of minority carriers decreases away from the junction – recombination

  • Carrier concentrations return

to equilibrium values more than a few diffusion lengths from the junction

slide-16
SLIDE 16

ELEG620: Solar Electric Systems University of Delaware, ECE Spring 2009 S. Bremner

Carrier Injection

  • Can assume that the drift and diffusion currents are roughly the same –

the nett current is small compared to both, this gives us:

  • And it follows that: and so
  • Next we can apply the condition of charge neutrality at the depletion

region edges (x = a and x = b) similarly

slide-17
SLIDE 17

ELEG620: Solar Electric Systems University of Delaware, ECE Spring 2009 S. Bremner

IV equation for pn junction

  • We now have the tools to find the IV equation for a pn junction

Poisson’s equation Transport Equations Continuity Equations We assume the following: 1. One dimensional device

  • 2. Thermal equilibrium
  • 3. Steady state
  • 4. Depletion approximation
slide-18
SLIDE 18

ELEG620: Solar Electric Systems University of Delaware, ECE Spring 2009 S. Bremner

Minority carriers in quasi-neutral region

  • Can make other simplifying assumptions:

– In quasi-neutral regions charge density is zero, as is the electric field, this means the current flow is purely diffusive – No generation, optical or otherwise G = 0 – Low level injection, minority carrier concentration is much lower than the majority carrier concentration – Recombination is Shockley Read Hall type, for the moment don’t worry, we just want the form which is where ∆n is excess carrier concentration and τn is minority carrier lifetime

We then obtain

p side and n side Note: we use two different variables for the distance, x on the n doped side and x’ on the p doped side

slide-19
SLIDE 19

ELEG620: Solar Electric Systems University of Delaware, ECE Spring 2009 S. Bremner

Minority carriers in quasi-neutral region

  • Using the continuity equation we get:
  • Combining with the transport equation gives us:
  • Finally, when we use the following identities and
  • We end up with: and
  • So the general solutions are

and

slide-20
SLIDE 20

ELEG620: Solar Electric Systems University of Delaware, ECE Spring 2009 S. Bremner

Minority carriers in quasi-neutral region

  • Need to solve for A and B using the boundary conditions, assuming

surfaces of the pn junction are far away

  • 1. Boundary condition at depletion region edge (x = 0)
  • 2. Boundary condition at “surface”, carrier concentration must be
  • finite, this forces A to be zero
  • This gives us the following exact solutions:
  • Notes: condition 1. will apply to most devices, the boundary condition at the surface
  • 2. can be generation or current as well as carrier concentration
slide-21
SLIDE 21

ELEG620: Solar Electric Systems University of Delaware, ECE Spring 2009 S. Bremner

Minority carriers in quasi-neutral Region

  • Remember we are assuming charge neutrality away from the depletion

region – majority carrier concentration goes up to match minority carrier concentration

  • Also keep in mind the carrier concentrations ‘die off’ due to

recombination as we move away from the depletion region

slide-22
SLIDE 22

ELEG620: Solar Electric Systems University of Delaware, ECE Spring 2009 S. Bremner

Minority carriers in quasi-neutral Region

  • Knowing how the carrier concentrations vary over distance allows us to

find the current e.g.

  • We find the current by only looking at the change in minority carrier

concentration (more on this later)

  • Easy enough to plug expressions

from earlier in and get the following:

slide-23
SLIDE 23

ELEG620: Solar Electric Systems University of Delaware, ECE Spring 2009 S. Bremner

Current flow in depletion region

  • Difficult to calculate since the electric field is present
  • Since depletion width is typically much smaller than diffusion length of

minority carriers can assume recombination is zero in depletion region sibnce carriers are swept through by the electric field

  • Any non-idealities mean we need to find an expression for the

recombination

  • Since we have no generation or recombination we have

and so the current for each carrier is a constant

slide-24
SLIDE 24

ELEG620: Solar Electric Systems University of Delaware, ECE Spring 2009 S. Bremner

Total Current

  • We have the minority carrier current and the current through the

depletion region but don’t have an easy way of finding majority carrier current

  • Don’t need to find since the current flowing through the pn junction

structure must be constant to avoid charging

  • So, in reality we only need to find the two

minority carrier currents at the edges of the depletion region

slide-25
SLIDE 25

ELEG620: Solar Electric Systems University of Delaware, ECE Spring 2009 S. Bremner

Meaning of Io

  • Ideal diode equation
  • Forward bias current depends on how many

carriers are at the edge of the depletion region, this is determined by diffusivity, recombination and background minority carrier concentration

  • Increasing recombination or diffusivity will

increase current

  • More heavily doped side dominates the current

flow

  • The forward bias current is a recombination

current

  • Higher band gap will give a lower recombination

current

slide-26
SLIDE 26

ELEG620: Solar Electric Systems University of Delaware, ECE Spring 2009 S. Bremner

Reverse Breakdown

  • Reverse bias increases electric field at junction and hence the diffusion current is

lowered

  • Drift current determined by the number of carriers being swept across the junction

– so drift current doesn’t increase significantly

  • Drift current does increase slightly, however, due to the depletion region

expanding and more carriers being thermally generated there, hence more current

  • If reverse voltage is high enough we get tunneling
slide-27
SLIDE 27

ELEG620: Solar Electric Systems University of Delaware, ECE Spring 2009 S. Bremner

Quasi-Fermi Levels

  • In Thermal equilibrium the Fermi level was given as the average energy of the

carriers (doesn’t change in equilibrium)

  • In steady state a quasi-Fermi level can be defined to describe the carrier

concentrations and device behavior analogously

  • Quasi Fermi level separation is a measure of the disturbance from equilibrium

with the separation being close to the bias (not always equal)

  • Since they measure the carrier concentration they relate to the current present

in the following way:

slide-28
SLIDE 28

ELEG620: Solar Electric Systems University of Delaware, ECE Spring 2009 S. Bremner

Quasi-Fermi Levels

  • Constant across the depletion region
  • Vary smoothly and gradually, only get sharp changes at interfaces
  • See above for a pn junction under forward bias in the dark
  • Note that the quasi – Fermi levels come back together away from

the depletion region because of recombination of carriers

slide-29
SLIDE 29

ELEG620: Solar Electric Systems University of Delaware, ECE Spring 2009 S. Bremner

Series Resistance

  • So far no resistance assumed but in reality there is always resistance

for current

  • Series resistance consists of the resistance of the quasi-neutral bulk

regions and the contact resistance (metal/sc)

  • Voltage across junction is lower than that

between contacts – current is lower than expected, becoming worse as current increases

slide-30
SLIDE 30

ELEG620: Solar Electric Systems University of Delaware, ECE Spring 2009 S. Bremner

High Injection

  • High injection is when the minority carrier concentration is close to the majority

carrier concentration – only low injection considered in derivation of IV equation

  • High injection comes about for high forward biases and will occur in the more

lightly doped side first

  • Recombination no longer determined solely

by minority carrier concentration, current is now:

  • There are other recombination mechanisms

present so current should be written where n is between 1 and 2. 2 represents high injection

slide-31
SLIDE 31

ELEG620: Solar Electric Systems University of Delaware, ECE Spring 2009 S. Bremner

Depletion Region Recombination

  • Recombination in the depletion region previously ignored but will be

dominant for low current

  • Since the n and p concentrations have to ‘cross’ since they are shifting

from majority carrier to minority carrier

  • Recombination will be maximum where the two carrier populations are

equal since in general R = B.n.p where B is a constant

  • A recombination ‘sweet spot’ will exist near

the centre of the depletion region

  • Since the current is a recombination

current the IV curve will be changed

slide-32
SLIDE 32

ELEG620: Solar Electric Systems University of Delaware, ECE Spring 2009 S. Bremner

Depletion Region Recombination

  • The current due to depletion region recombination is given by:

Forward bias Reverse bias