
SLIDE 1
7/27/2017 1
ADDRESSING STORMWATER GOALS WITH CONTINUOUS MONITORING AND ADAPTIVE CONTROL
WEF eShowcase July 27, 2017
Marcus Quigley - OptiRTC, Inc.
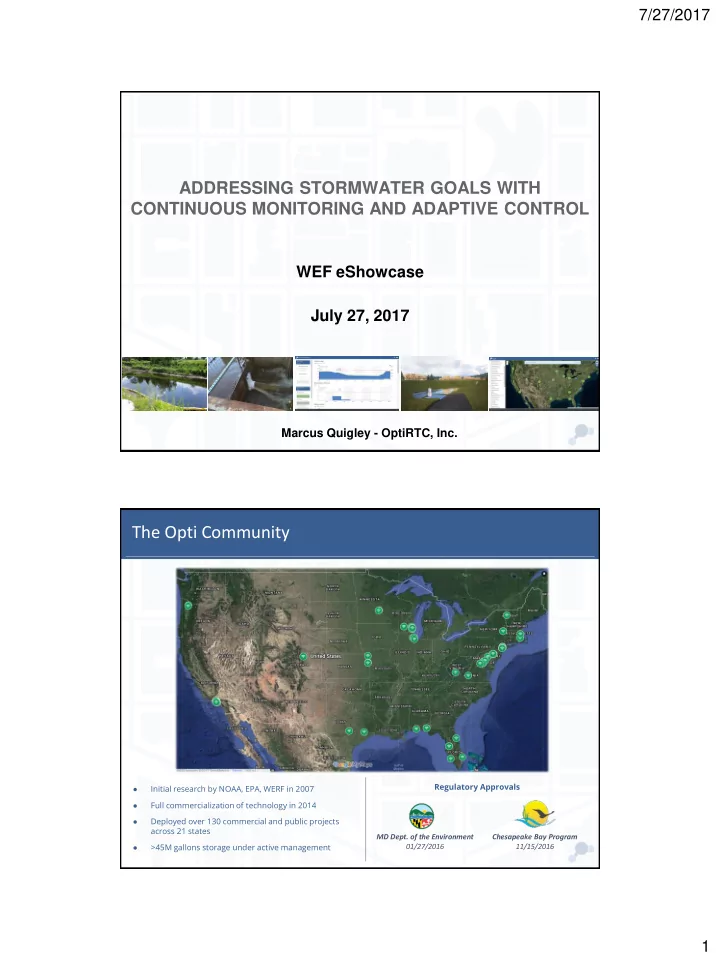
- Initial research by NOAA, EPA, WERF in 2007
- Full commercialization of technology in 2014
- Deployed over 130 commercial and public projects
across 21 states
- >45M gallons storage under active management
The Opti Community
Regulatory Approvals Chesapeake Bay Program 11/15/2016 MD Dept. of the Environment 01/27/2016