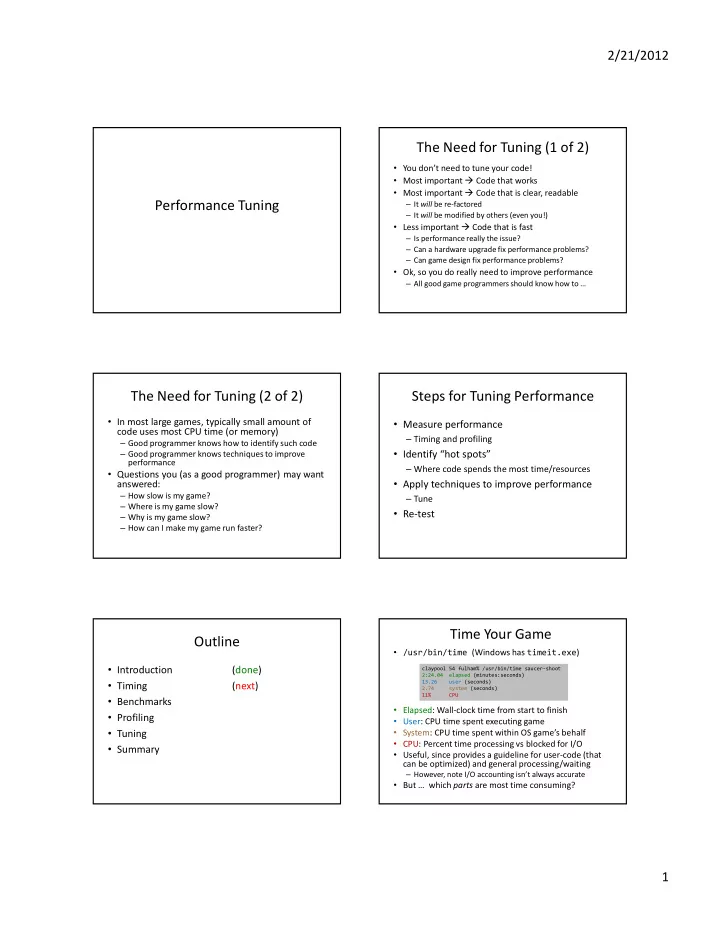
the need for tuning 1 of 2
play

The Need for Tuning (1 of 2) You dont need to tune your code! Most - PDF document

2/21/2012 The Need for Tuning (1 of 2) You dont need to tune your code! Most important Code that works Most important Code that is clear, readable Performance Tuning It will be re-factored It will be modified by


  1. 2/21/2012 The Need for Tuning (1 of 2) � You don’t need to tune your code! � Most important � Code that works � Most important � Code that is clear, readable Performance Tuning � It will be re-factored � It will be modified by others (even you!) � Less important � Code that is fast � Is performance really the issue? � Can a hardware upgrade fix performance problems? � Can game design fix performance problems? � Ok, so you do really need to improve performance � All good game programmers should know how to … The Need for Tuning (2 of 2) Steps for Tuning Performance � In most large games, typically small amount of � Measure performance code uses most CPU time (or memory) � Timing and profiling � Good programmer knows how to identify such code � Identify “hot spots” � Good programmer knows techniques to improve performance � Where code spends the most time/resources � Questions you (as a good programmer) may want � Apply techniques to improve performance answered: � How slow is my game? � Tune � Where is my game slow? � Re-test � Why is my game slow? � How can I make my game run faster? Time Your Game Outline � /usr/bin/time (Windows has timeit.exe ) � Introduction (done) claypool 54 fulham% /usr/bin/time saucer-shoot 2:24.04 elapsed (minutes:seconds) � Timing 13.26 user (seconds) (next) 2.74 system (seconds) 11% CPU � Benchmarks � Elapsed: Wall-clock time from start to finish � Profiling � User: CPU time spent executing game � Tuning � System: CPU time spent within OS game’s behalf � CPU: Percent time processing vs blocked for I/O � Summary � Useful, since provides a guideline for user-code (that can be optimized) and general processing/waiting � However, note I/O accounting isn’t always accurate � But … which parts are most time consuming? 1

  2. 2/21/2012 Time Parts of Your Game Outline � Call before and after � Introduction (done) start = getTime() // do stuff � Timing (done) stop = getTime() � Benchmarks elapsed = stop - start (next) � (Where did we do this before?) � Profiling � Use Dragonfly Clock � Remember, this is not a singleton � Tuning � E.g. � Summary clock.delta() Pathfind() elapsed = clock.delta() o oo Benchmark Bounce – What is it? o � Benchmark – a program to assess relative performance � A benchmark designed to estimate Dragonfly � E.g. Compare ATI and NVIDIA video cards � E.g. Compare Google Chrome to Mozilla Firefox performance � A “good” benchmark will assess performance using typical � Primarily dependent upon number of objects can workload support at target frame rate � Getting “typical” workload often difficult part � Use benchmark to compare performance before and after � Assumes “standard” game creates many objects performance. E.g. that move and interact � Run benchmark on Dragonfly � old � Tune performance � Bounce stresses Dragonfly by creating many objects � Run benchmark on Dragonfly � new � When Dragonfly can’t keep up, has reached limit � Is new better than old? � What is a good benchmark for Dragonfly? What should it � Record value – provides basis for comparison do? oo o oo o Bounce Details Screenshot/Demo o o � Balls random speed (0.1 to 1 spaces/step) and direction Steps to use � Balls solid, so collide with other objects and screen edge � Start � 0 Balls 1. Download from Web � Each step � Create one ball page � So, about 30/second 2. Compile � Record frame time for latest 30 steps � Modify Makefile to point � So, about 1 second of time to Dragonfly � Compute median � If median 10% over target frame time (33 ms) , stop 3. Run iteration http://www.youtube.com/watch?v=8 � Record number of Balls created 2GGLjyz3lY&feature=youtu.be � After three iterations � average Balls/iteration is max objects ( bounce-mark ) (Show code: Ball, Bouncer, bounce) 2

  3. 2/21/2012 o o oo oo Bounce Data (1 of 2) Bounce Data (2 of 2) o o Bounce - a Dragonfly Benchmark (v1.0) ** Average maximum number of objects (bounce-mark): 1803 ** � grep BOUNCE dragonfly.log 05:29:36 BOUNCE: Frame 1 - 33 of 33 msec ( median is 0 ) 05:29:36 BOUNCE: Frame 2 - 33 of 33 msec ( median is 0 ) 05:29:36 BOUNCE: Frame 3 - 33 of 33 msec ( median is 0 ) … 05:30:30 BOUNCE: Frame 1634 - 34 of 33 msec ( median is 33 ) 05:30:30 BOUNCE: Frame 1635 - 34 of 33 msec ( median is 34 ) 05:30:30 BOUNCE: Frame 1636 - 37 of 33 msec ( median is 34 ) 05:30:30 BOUNCE: Frame 1637 - 33 of 33 msec ( median is 33 ) … 05:32:34 BOUNCE: Frame 1772 - 38 of 33 msec ( median is 36 ) System 05:32:34 BOUNCE: Frame 1773 - 39 of 33 msec ( median is 37 ) Intel I5-2500, 3.30 GHz 05:32:34 BOUNCE: Iteration 3 - max objects: 1773 8GB RAM 05:32:34 BOUNCE: Done. Average max objects: 1780 Windows 7 64-bit, Service Pack 1 Cygwin o o oo oo Bounce Results Bounce – What Does it Mean? o o � 61x20 squares. Dependent upon resolution? � Provides target maximum number of moving objects � 2400x1250 pixels � 675 objects Engine can support � 500x300 pixels � 652 objects � Note, game-code computations “cost”, too, so will decrease � 290x100 squares. Dependent upon squares? max � ~2400x1250 pixels � 467 objects � Note, if single moving object, can support about n 2 as many � ~500x300 pixels � 466 objects objects (e.g. Walls) � What about remotely (via putty) to CCC systems? � In general: � 80x24 � 1041, 1036 B = estimated maximum reported by Bounce � 317x86 � 731, 740 � 80x24 (jumbo font) � 1351 M = number of moving objects � 100x459 (jumbo font) � 382, 390 S = number of static (non-moving) objects � May want to take minimum bounce-mark. Or, may want Need � M * (M + S) <= B 2 take “typical” setup. Or, may want your setup. � Note, this could be refined with “velocity” for more � Will definitely want setup that meets target specifications! accuracy (and more complications) oo o How to Use for Planning Outline o � Say Bounce reports 500 objects for target setup (B = 500) � Making game, say a maze runner � Introduction (done) � 100x100 walls � Hero and up to 10 bad guys M * (M + S) <= B 2 � Timing (done) � Can Dragonfly support? � M = 11, S = 10000 � Benchmarks � 11 * (11 + 10000) <= 500*500 ? (done) � 110,121 <= 250,000 ( yes ) � Say 10x bigger world. And bullets, up to 50 “in flight” during firefight � Profiling (next) � Can Dragonfly support? � M = 61, S = 100000 � Tuning � � 61 * (61 + 100000) <= 250000 � � 6,103,721 <= 250,000 ( no ) � Summary � What to do? � Tune code (more later) � Design differently � Don’t spawn bad guys until Hero can see them � Make levels smaller (but have more of them) � Make sections of walls combined � multiple objects to one � Reduce movement speed / fire rate 3

  4. 2/21/2012 Profiling gprof � Why? � GNU profiler � Learn where program spent time executing � Linux, and can install with cygwin, too � Which functions called � Works for any language GNU compiler supports: C, C++, Objective- � Can help understand where complex program spends C, Java, Ada, Fortran, Pascal … � For us � g++ its time � Broadly, after profiling, outputs: flat profile and call graph � Can help find bugs � Flat profile provides overall “burn” perspective � How? � How much time program spent in each function � Re-compile so every function call records some info � How many times function was called � � After running, profiler figures out what called, how Call graph shows individual execution profile for each function � Which functions called it many times � Which other functions it called � Also, takes samples to see where program is (about � How many times 100/sec) � Estimate how much time in subroutines of each function � Keeps histogram http://docs.freebsd.org/44doc/psd/18.gprof/paper.pdf Running gprof Example - Bounce 1) Compile with –pg flag � Compile � Need for creating all .o files g++ -c –pg -I../../dragonfly Ball.cpp -o Ball.o g++ -c –pg -I../../dragonfly Bouncer.cpp -o Bouncer.o � And need when linking! g++ bounce.cpp Ball.o Bouncer.o libdragonfly.a –pg -o bounce -lncurses -lrt 2) Run program normally � Produces file “ gmon.out ” (overwritten if there) � Note, program must exit normally! (e.g. via exit() or � Run ./bounce return from main() ) 3) Run gprof on program � Uses data from gmon.out � Profile gprof bounce > out � Often, redirect to file via ‘ > ’ 4) Analyze output � Analyze (emacs or vi or pico or less) out Gprof – Flat Profile (e.g. QuickSort) Gprof – Call Graph Profile Observations Explanations � swap() called many times, but each � Each line describes one function fast � name: name of function � consumes only 9% of overall time � %time: percentage of time spent exececuting � partition() called many times, fast � cumulative seconds: total time spent � consumes 85% of overall time � self seconds: time spent executing � Each section describes one function � calls: number of times function called Conclusions � Which functions called it, and how much time was consumed (excluding recursive) � Improve performance � make � Which functions it calls, how many times, and for how long � self s/call: avg time per exec (excluding partition() faster � Usually overkill � we won’t look at it in too much detail descendents) � Don’t try to make fillArray() or � total s/call: avg time per exec (including quicksort() faster descendents) 4

Download Presentation
Download Policy: The content available on the website is offered to you 'AS IS' for your personal information and use only. It cannot be commercialized, licensed, or distributed on other websites without prior consent from the author. To download a presentation, simply click this link. If you encounter any difficulties during the download process, it's possible that the publisher has removed the file from their server.

Recommend


More recommend