
SLIDE 1
The Log-Linear Model
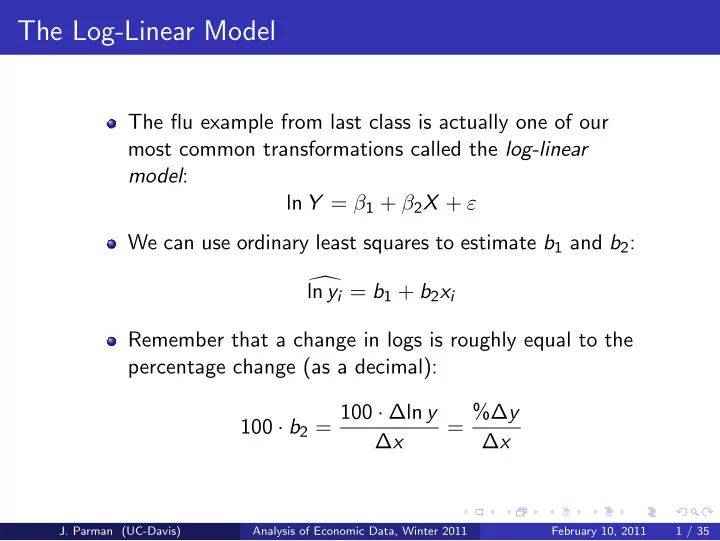
The flu example from last class is actually one of our most common transformations called the log-linear model: ln Y = β1 + β2X + ε We can use ordinary least squares to estimate b1 and b2:
- ln yi = b1 + b2xi
Remember that a change in logs is roughly equal to the percentage change (as a decimal): 100 · b2 = 100 · ∆ln y ∆x = %∆y ∆x
- J. Parman (UC-Davis)
Analysis of Economic Data, Winter 2011 February 10, 2011 1 / 35