
SLIDE 1
2/9/2017 1 The linkage between basic psychological needs and psychosocial functioning
- f adolescents with visual impairments
Eline Heppe MSc
- Dr. Sabina Kef and Prof. dr. Carlo Schuengel
Vrije Universiteit Amsterdam
BACKGROUND INFORMATION
Visual impairments
From: e.g. Kef (2002) and Pinquart & Pfeiffer (2012)
- Heterogeneity
- Challenges:
- Orientation and mobility
- Communication
- Social participation
- Psychosocial functioning
Vrije Universiteit Amsterdam
BACKGROUND INFORMATION
Vrije Universiteit Amsterdam
BACKGROUND INFORMATION
Vrije Universiteit Amsterdam
AIM
- 2. What is the association between the three basic psychological
needs and psychosocial functioning?
- 1. How are the three basic psychological needs represented among
adolescents with visual impairments in the Netherlands?
- 3. Which factors can facilitate or frustrate the satisfaction of the
three basic psychological needs?
Vrije Universiteit Amsterdam
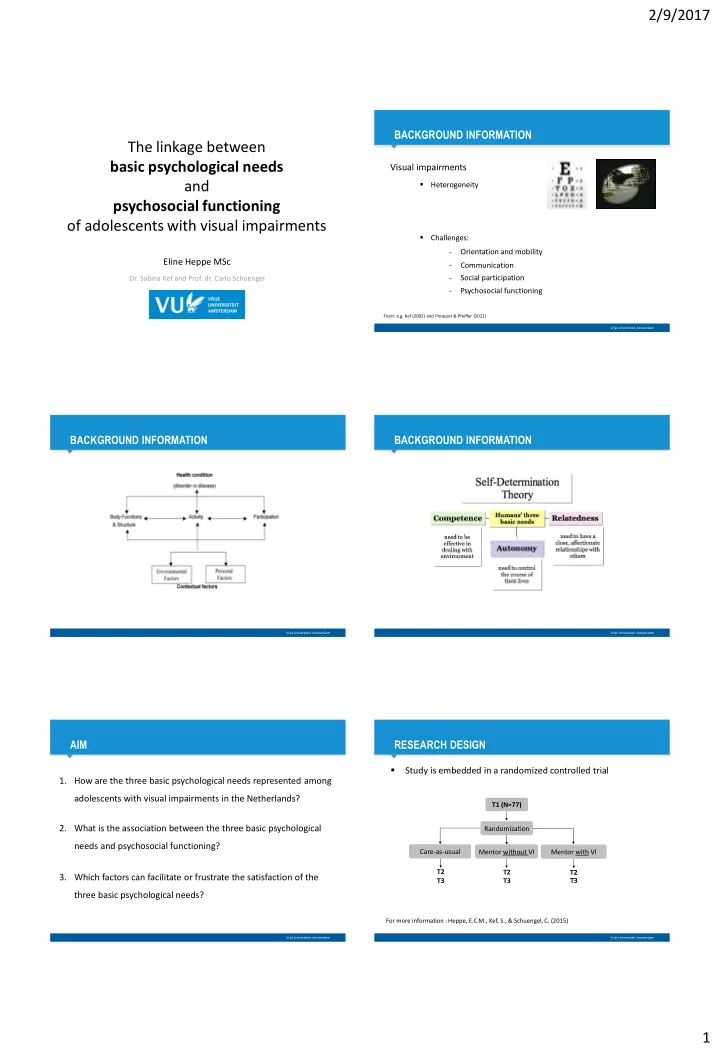
RESEARCH DESIGN
- Study is embedded in a randomized controlled trial
T3 T1 (N=77) Mentor with VI Mentor without VI Care-as-usual T2 Randomization T2 T3 T2 T3
For more information : Heppe, E.C.M., Kef, S., & Schuengel, C. (2015)