The Issues The Context Mine Water Management Water supply - - PowerPoint PPT Presentation

the issues the context mine water management
SMART_READER_LITE
LIVE PREVIEW

The Issues The Context Mine Water Management Water supply - - PowerPoint PPT Presentation

The Issues The Context Mine Water Management Water supply Community concerns Heaven or Hell for Excess water Environmental protection Hydrologic Modellers? Water quality Regulatory control Mines constantly


slide-1
SLIDE 1

Mine Water Management

Steve Perrens

Heaven or Hell for Hydrologic Modellers?

2

The Issues The Context

 Water supply  Excess water  Water quality  Community concerns  Environmental protection  Regulatory control

Mines constantly evolve
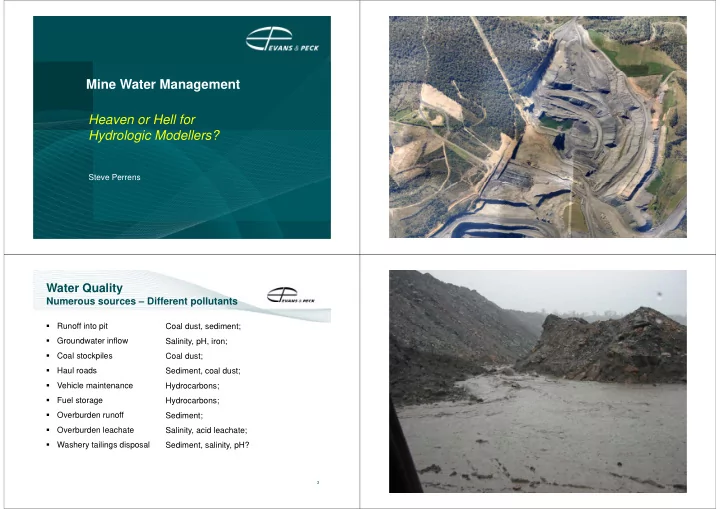
  • Runoff into pit
  • Groundwater inflow
  • Coal stockpiles
  • Haul roads
  • Vehicle maintenance
  • Fuel storage
  • Overburden runoff
  • Overburden leachate
  • Washery tailings disposal

3

Water Quality

Numerous sources – Different pollutants

Coal dust, sediment; Salinity, pH, iron; Coal dust; Sediment, coal dust; Hydrocarbons; Hydrocarbons; Sediment; Salinity, acid leachate; Sediment, salinity, pH?

4

slide-2
SLIDE 2

5

Comparison of sediment dam and drainage line water quality

50 100 150 200 250 300 350 400 450 500 0% 10% 20% 30% 40% 50% 60% 70% 80% 90% 100% Total Suspended Solids (mg/L) Percentile Dam 1 Dam 2 Dam 3 Dam 4 Dam 5 5,000 10,000 15,000 20,000 25,000 0% 10% 20% 30% 40% 50% 60% 70% 80% 90% 100% Total Suspended Solids (mg/L) Percentile

Rising stage samples

Monthly 1 2 3 4 5

6

Mine Water Quantity & Quality

 Highly variable over time;  Pit & overburden area variable throughout mine life;  Groundwater inflow to pit variable – generally related to depth of pit;  Groundwater inflow to U/G workings variable depending of mine layout;  Runoff highly variable depending on climate (typical annual variation: 20% - 300% of average)  Consequences of changes to mine plan

7

Management Issues

 Sufficient supply for mine operations:

  • Dust suppression
  • Longwall operation
  • Coal washing

 Sufficient storage to meet operational requirements

  • Reliability of supply
  • Storage of excess – without compromising production
  • Treatment and discharge in the event of excess?

 Minimise discharge (zero discharge preferred)

  • Divert external catchments
  • Enhanced use/loss (irrigation, evaporation)
  • Water quality (sediment, salinity)
  • Treatment
  • HRSTS.

8

Regulatory Issues

 Water access licenses for incidental take

  • Unavoidable groundwater make
  • Problem when linked to ‘cease to pump’ rules in the WSP
  • Aquifer interference policy
  • Return flows not counted

 Water access licenses for supply;

  • Availability of surface and groundwater licenses
  • Supply reliability

 Discharge licenses/permits

slide-3
SLIDE 3

Mine Water Management

Steve Perrens

10 11 12

Issues

 Complex interactions between

  • Evolving mine landform
  • Rehabilitated and ‘natural’ catchments
  • Water management system
  • Storage requirements

 Water balance highly dependent on climate  Increasing salinity:

  • Deeper pits
  • Underground mining
slide-4
SLIDE 4

13

Issues

 Alterations to mine plan and production  Short term variation in CHPP throughput  Operating rules for exchange of water between mines  Opportunities for discharge from sites

14

Predicted Annual ROM Supply and CHPP Water Requirement

(Assumes slurry disposal)

500 1,000 1,500 2,000 2,500 3,000 3,500 4,000 4,500 5,000 5,500 6,000 6,500 5 10 15 20 25

ROM and Water Requirement

Project Life (Years)

ROM (t x 1,000) CHPP Water (ML) 15

Projected Tailings Storage Requirements

5 10 15 20 25 5 10 15 20 25 Cumulative Tailings Volume (m3 x 106) Project Life (Years)

16

Mine Water Balance

 Water sources (internal and external)  Water demands

  • Dust suppression,
  • Coal processing,
  • Underground operations

 Losses / discharge  Storage

slide-5
SLIDE 5

17

Water Demands

 Dust suppression,

  • Mainly achieved by water spray

(chemicals in special situations)

  • Differentiate between stockpiles and haul roads

 Consistency of approaches by air quality modellers and hydrologists?  Underground operations

  • Typical longwall – 1 ML/day
  • Dust suppression

Dust Suppression

18

 Dust suppression – haul roads

  • Mainly achieved by water spray

(chemicals in special situations)

  • Dependent on haul area and weather (rainfall and wind)
  • Little benchmarked data in Australia
  • South African research – water required to maintain wet surface

(effects of road albedo and wheel movement)  Dust suppression – coal stockpiles

  • Dependent on dump height and reclaim process

 Consistency of approaches by air quality modellers and hydrologists?

19

Water Demands

 Coal processing – dependent on

  • Mining process and source characteristics

(Open-cut ± 12% fines; Underground ± 8% fines)

  • Dewatering process

 Underground operations

  • Typical longwall – 1 ML/day
  • Dust suppression

Treatment Relative Water Requirements Slurry disposal 100% Secondary flocculation 90% Paste thickener 60% Belt press 40% Pressure filter 30% Solid bowl centrifuge 30%

20

Why do we use models?

 Prediction of interaction between the mine, climate and the surrounding environment  Assessment (design) of the location and size of facilities necessary to manage water  Understanding the risks  Ongoing management of water at an operating site:

  • Are predictions valid/correct?
  • Does management need to change?
  • Are new/additional facilities necessary?
slide-6
SLIDE 6

21

Modelling Considerations

 Adequacy of supply - enough water?  Adequate storage –

  • Seasonal variation of rainfall and evaporation
  • Probability of extreme sequences of rainfall
  • Variation of groundwater make
  • Year-to-year carry-over of water

 Discharge frequency, volume and quality  Relevant timescale to characterise runoff and mine

  • perations

 Data requirements and availability

22

Mine Site Models

 System models:

  • Water gains and losses
  • Storages
  • Water conveyance (channels, pumps, pipelines)
  • Operating rules/triggers

 Process models:

  • Groundwater make
  • Runoff from different surfaces
  • Water uses (dust suppression, coal washing, etc)
  • Losses (evaporation, seepage)

23 24

slide-7
SLIDE 7

AWBM

25 26

 Automatic AWBM calibration for full data set with one year omitted  Use estimated parameters to model runoff for missing year  Assess adequacy of fit between modelled and observed (Total volume, R2, Nash-Sutcliffe coefficient of efficiency, flow duration, etc)  Repeat process taking out successive years of data  Assess statistics of parameters and goodness of fit to select parameters for adoption

Model Parameter Estimation Leave One Out Cross Validation

27

AWBM

28

0.01 0.10 1.00 10.00 0% 10% 20% 30% 40% 50% 60% 70% 80% 90% 100% Runoff (mm/day) Percent of Time Runoff is Equalled or Exceeded

Flow Duration

Actual Calculated 0% 20% 40% 60% 80% 100% 0% 10% 20% 30% 40% 50% 60% 70% 80% 90% 100% Percent of Total Volume of Cumulative Runoff Percent of Time over which Cumulative Runoff Volume Occurs

Cumulative Runoff

Actual Calculated

slide-8
SLIDE 8

 Derived from groundwater modelling  Relatively steady day to day  Significant variation

  • ver mine life –

depends on mine plan

Groundwater Inflows to Pit and Underground Workings

29

100 200 300 400 500 600 700 800 5 10 15 20 25 Annual Dewatering (ML/year) Mine Year

Storage Requirements – median rainfall Sequence: A

30

Storage Requirements – median rainfall Sequence: B

31

Storage requirements – risk profile (± 125 years rainfall data)

32

slide-9
SLIDE 9

 Salt balance – conservation of mass  Final void salinity – water and salt balance:

  • Groundwater leaching through in-pit spoil
  • Surface runoff from void
  • Groundwater loss from ‘lake’ (or make)
  • Evaporation loss (accounting for depth of void)

Need for strong linkage between surface and groundwater models

Water quality modelling

33 154 156 158 160 162 164 166 168 170 172 174 100 200 300 400 500 600 700 800 900 1000 Void Water Level (m AHD) Years Following Mine Closure 132 134 136 138 140 142 144 146 148 150 152 100 200 300 400 500 600 700 800 900 1000 Void Water Level (m AHD) Years Following Mine Closure 1,000 2,000 3,000 4,000 5,000 6,000 10 20 30 40 50 60 70 80 90 100 Salinity (mg/L) Years Following Mine Closure Existing Climate Climate Change 2,000 4,000 6,000 8,000 10,000 12,000 10 20 30 40 50 60 70 80 90 100

Salinity (mg/L) Years Following Mine Closure

Existing Climate Climate Change

Dr Steve Perrens

Evans & Peck (02) 9495 0500 sperrens@evanspeck.com