
SLIDE 1
THE ICARUS EXPERIMENT: latest results
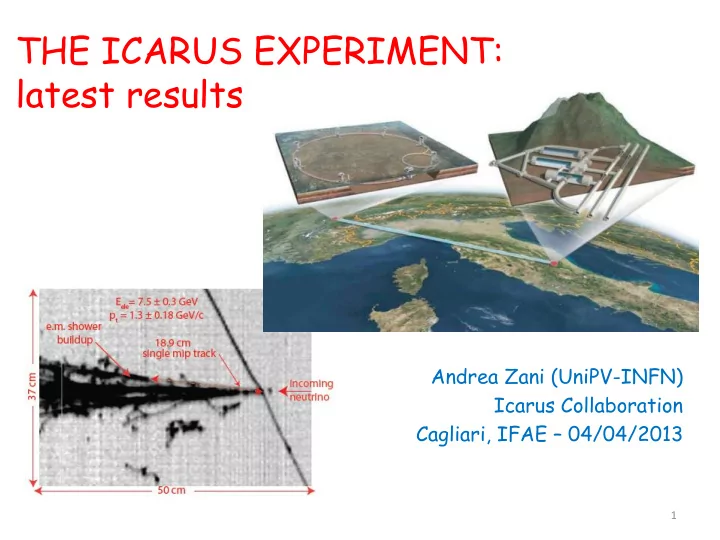
Andrea Zani (UniPV-INFN) Icarus Collaboration Cagliari, IFAE – 04/04/2013
1
THE ICARUS EXPERIMENT: latest results Andrea Zani (UniPV-INFN) - - PowerPoint PPT Presentation
THE ICARUS EXPERIMENT: latest results Andrea Zani (UniPV-INFN) Icarus Collaboration Cagliari, IFAE 04/04/2013 1 Outline Introduction: Liquid Argon Technology and detector present state Latest results: sterile neutrinos and
Andrea Zani (UniPV-INFN) Icarus Collaboration Cagliari, IFAE – 04/04/2013
1
4/4/2013
2
4/4/2013
3
a Laboratori Nazionali del Gran Sasso dell'INFN, Assergi (AQ), Italy b Dipartimento di Fisica e INFN, Università di Padova, Via Marzolo 8, I-35131 Padova, Italy c Dipartimento di Fisica Nucleare e Teorica e INFN, Università di Pavia, Via Bassi 6, I-27100 Pavia, Italy d Dipartimento di Scienze Fisiche, INFN e Università Federico II, Napoli, Italy e INFN, Sezione di Milano e Politecnico, Via Celoria 16, I-20133 Milano, Italy f Henryk Niewodniczanski Institute of Nuclear Physics, Polish Academy of Science, Krakow, Poland g Department of Physics and Astronomy, University of California, Los Angeles, USA h INR RAS, prospekt 60-letiya Oktyabrya 7a, Moscow 117312, Russia i CERN, CH-1211 Geneve 23, Switzerland j Institute of Physics, University of Silesia, 4 Uniwersytecka st., 40-007 Katowice, Poland k National Centre for Nuclear Research, A. Soltana 7, 05-400 Otwock/Swierk, Poland l Laboratori Nazionali di Frascati (INFN), Via Fermi 40, I-00044 Frascati, Italy m Institute of Radioelectronics, Warsaw University of Technology, Nowowiejska, 00665 Warsaw, Poland n INFN, Sezione di Pisa. Largo B. Pontecorvo, 3, I-56127 Pisa, Italy
4/4/2013
4
Two identical modules…
… and four wire chambers
by the cathode -> 1.5 m drift length
Detectors
pitch)
(TPB), sensitive at 128 nm (VUV) Electronics
cathode TPC wires LNGS -Hall B LN2 storage
T600
4/4/2013
5
CNGS nm charge current interaction, one of TPC’s shown
Collection (top view) Induction 2 (top view) Induction 1 (frontal view)
scintillation light collection
I MODULE II MODULE
60 ppt O2 equiv.
4/4/2013
6
(≤ 0.1 ppb – O2 equivalent) must be reached and preserved.
in the liquid and in the gas phase. For most of the data taking period electron lifetime t > 5 ms (i.e. impurity level at 60 ppt O2 eq, minimum needed 1.5 ms) -> max signal attenuation on 1.5 m drift: ≈ 17% -> good starting point for future multi-ton experiments.
PUMP MAINTENANCE
2010: Oct. 1 – Nov. 22
5.8 1018 pot
2012: Mar. 23 – Dec.3
3.54 1019 pot
2011: Mar. 19 – Nov. 14
4.44 1019 pot
4/4/2013
7
Collected 8.6 x 10¹⁹ protons
Detector live-time > 93%.
Superluminal n (run with bunched beam:
(2012) 270;
049.
n oscillations
73:2345).
4/4/2013
8
nmCC energy deposit
1 m.i.p. 2 m.i.p.
Total energy reconstr. from charge integration
calorimeter with excellent accuracy for contained events Tracking device
Measurement of local energy deposition dE/dx
data dE/dx vs residual range compared to Bethe-Bloch curves
Low energy electrons: σ(E)/E = 11%/√ E(MeV)+2%
σ(E)/E = 3%/√ E(GeV) Hadron showers: σ(E)/E ≈ 30%/√ E(GeV)
4/4/2013
9
cathode CNGS beam primary vertex
kaon
Collection Induction 3D reconstruction dE/dx based PID
p
K
μ New 2D => 3D approach for LAr TPC (AHEP, vol. 2013, article ID 260820) 3D object driven by optimization of its 2D projections (no need for drift matching)
4/4/2013
10
g conversion 0.02 X0 sampling
MC PP MC Compton ··· MC PP+Compton CNGS Data
4/4/2013
11
Neutrino masses and the evidence of oscillations represent today a main experimental evidence of physics beyond the Standard Model. Though, neutrino properties are still largely unknown, so their study is a priority in the completion of our SM knowledge. Sterile neutrinos were first hypothesized by B. Pontecorvo in 1957, as particles not interacting via any SM interaction but gravity. Nonetheless they could mix with standard neutrinos via a mass term. Recently experimental neutrino anomalies started to build up, which could be explained with the oscillation into sterile neutrinos:
LSND experiment and later confirmed by MiniBooNE with nm/nm beams
new ≈ 10-2 ÷ 1 eV2 .
sources in Gallium experiments (originally designed to detect solar ne)
new >> 1 eV2.
Combined evidence for some possible anomaly is ≈ 3.8 s.
4/4/2013
12
ne CC event recognition becomes crucial, and possible due to unique Liquid Argon feature and our reconstruction algorithms.
nm ne search at LNSG with ICARUS T600 and the 20 GeV nm CNGS beam. Difference with LSND experiment: LSND: L/E ≈ 1 m/MeV ICARUS: L = 730 km -> L/E ≈ 36.5 m/MeV LSND short baseline signal averages to sin2(1.27Dm2
new L/E) ≈ ½ , and
<P(nm ne)> ≈ 1/2 sin2(2qnew) ICARUS operates in a region where standard n-oscillations are less relevant, w.r.t. other long baseline experiments.
In ICARUS there are 1091 n events currently available (from 3.3 x 10¹⁹ pot, 2010-2011 data, half the total statistic) -> compatible with MC expectation within 6%. CNGS beam (10 ≤ En ≤ 30 GeV) is an almost pure nm beam: expected ne events:
production, (3n mixing). Total: 5.0 ± 0.6 events. Expected events, weighting for efficiency: 3.7 ± 0.6 events. Selections for ne during visual scan:
excluding d-rays), later developing into EM shower.
vertex, at least in one view between Coll and Ind2.
4/4/2013
13
4/4/2013 14
volume and energy cuts;
efficiency;
Typical MC event Only vertex region is shown
performed on a larger sample of MC events, is consistent with visual scan, returning the same 0.74 efficiency.
In both events: single electron shower in the transverse plane clearly opposite to hadronic component
4/4/2013
15
(a) vis Etot = 11.5 ± 1.8 GeV, pt = 1.8 ± 0.4 GeV/c (b) vis Etot = 17 GeV, pt = 1.3 ±0.18 GeV/c
4/4/2013
16
sin2(2qnew) Dm2
new(eV2)
Within the present observation, our results is consistent with the absence of the LSND anomaly. Moreover the long baseline should enhance the oscillation probability: Expected 30 events with E ≤ 30 GeV for (Dm2
new , sin2(2qnew)) = (0.11 eV2, 0.10) .
Weighting for efficiency, our limits on the number of events due to LSND anomaly are: ≤3.4 (90% CL) and ≤7.1 (99% CL), P(nm ne) ≤ 5.4 x 10⁻³; P(nm ne) ≤ 1.1 x 10⁻².
4/4/2013
17
MiniBooNE limit KARMEN limit Allowed LSND 90% Allowed LSND 99%
ICARUS results strongly limit the allowed parameters values for LSND anomaly indicating a narrow region (Dm2, sin22q) = (0.5 eV2, 0.005) where there is overall agreement (90% CL) among:
ICARUS excluded region
4/4/2013
18
Proposed P-347 experiment at CERN-SPS:
violations. The experiment will rely on:
for the expected anomalies;
Dm2
new and sin2(2qnew) separately identified;
channels with ‘‘Gargamelle’’-class LAr-TPC’s;
relevant effects detectable at the percent level (>106 nm ≈ 104 ne);
4/4/2013
19
100 GeV primary proton beam fast extracted from SPS in North Area: C-target station next to TCC2 + two magnetic horns, 100 m decay pipe, 15 m of Fe/graphite dump, followed by m stations. Interchangeable n and anti n focusing.
Near position: 460 m 150t LAr-TPC detector to be built + magnetic spectrometer Far position: 1600 m ICARUS-T600 detector + magnetic spectrometer
New CERN SPS 2 GeV neutrino facility in North Area
T150 near detector T600 far detector
4/4/2013
20
Enhanced (90%) e detection efficiency (0.1% NC 0 misinterpretation prob.) is expected, thanks to improved conditions at CERN-SPS:
Expected signal/bkg. rates for 4.5 x 10¹⁹ pot (1 year data taking), from the
new = 0.4 eV2, sin2(2qnew) = 0.01.
~1200 ne oscillation signals over 5000 background events
4/4/2013
21
e-appearance 1 year nm beam (left) 2 years nm beam (right) 4.5 x 10¹⁹ pot/y. In both cases the LSND allowed region will be fully explored. e/m disappearance 1 year nm beam (straight line) 1 year nm + 2 years nm beam (dotted line) Combined Gallium exp. + reactors anomalies widely explored.
three years (now operating with cosmic rays).
technology and efficient reconstruction algorithms -> investigation of sterile neutrino oscillation is made possible.
P(nm ne) ≤ 5.4 x 10⁻³ (90%CL); P(nm ne) ≤ 1.1 x 10⁻² (99%CL)
new T150 detector, exposed to 2 GeV n beam at 1.6km, 460m baseline -> full investigation of parameter spaces for neutrino anomalies.
4/4/2013
22
4/4/2013
23
4/4/2013
24
4/4/2013
25
Following the identification of an event, the first step to reconstruction (reco) is the hit finding (usually done on Collection and Induction2 planes). Hits are also fitted in Collection to calculate the total energy of the event. Run 10642
Collection wire drift Zoom on vertex, showing the single hits per wire that are recognized by the hit finding algorithm.
4/4/2013
26
After single hits per each wire are identified by a dedicated algorithm, they, along with information they carry (position, drift time, charge deposition), are grouped together in clusters to reconstruct the structures they belong to: tracks, showers.
Clustering In each view -> 2D objects!
Vertexes identification, separation of secondary tracks (e.g. d ’s on a m-track) nm CC event
m
bremsstrahlung Vertices Cathode Cluster of hits associated to m
4/4/2013
27
3.5 mm
drift wire coordinate The obvious way to obtain 3D reconstruction would be to try and match hits and track end points among the views, but there are problems:
to drift direction);
short tracks;
‘’horizontal’’ (i.e. parallel to wires
in 2D) tracks;
Horizontal track
4/4/2013
28
Instead of working on 2D projections (Pi(T)) to be matched afterwards, we directly minimize the 3D fit (F) by simultaneous optimization of the 2D fits (Pi(F)). 𝑄𝐽2(T) 𝑄𝐷(T) 3D fit F Cj(F) are constraints, mostly related to already reconstructed interaction points. As a result: One overall 3D fit for the 3D real object (track), no more drift matching and wire correlation -> no more discretization, verified higher efficiency with horizontal tracks (see next slide).
4/4/2013
29
G(F) inspired by Polygonal Line Algorithm (PLA): fit approximated by a polygonal described by 3D points (nodes) connected by straight 3D segments, with the distance from data point given as function of 2D projections in the three ICARUS views. Local solution
2D distance Pi(F)-2D data for a node 3D distance fit-3D vertices Constraint on angles between 3D segments