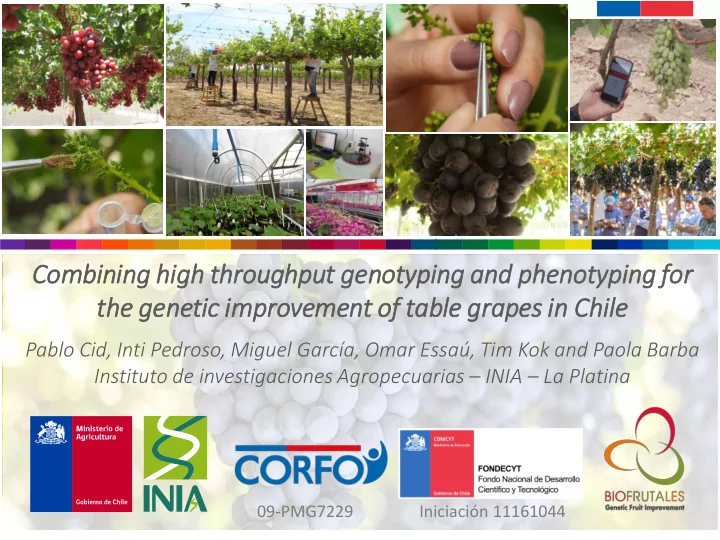

Com ombinin ing hig high throughput gen genotypin ing and and ph phenotypin ing for or the gen enetic im improvement of of table grapes in in Chil ile Pablo Cid, Inti Pedroso, Miguel García, Omar Essaú, Tim Kok and Paola Barba Instituto de investigaciones Agropecuarias – INIA – La Platina 09-PMG7229 Iniciación 11161044
Uquillas , Carolina, et al. "‘ Iniagrape- one’, a New Chilean Table Grape Cultivar." HortScience 48.4 (2013): 501-503.
Seedling Field Phenotyping New plants to evaluate Last season 5+ 7 12 Hectáreas de vides en distintas etapas de crecimiento La Pintana, Santiago
Development of agro-informatic solutions using Open Source software - Kernel (~database) design. Software architecture adapted to grapevine breeding process. - Tool development for data handling - Vine Tracker - Berry Analyzer Vine Data Tracker Analysis Data Berry Consult Analyzer
Vine Tracker Our own mobile app for field data Maturity assessment (16 ° Brix)
Vine Tracker Our own mobile app for field data Maturity assessment (16 ° Brix) Harvest characterization
Vine Tracker Our own mobile app for field data Selection Maturity assessment (16 ° Brix) Harvest characterization
Vine Tracker Our own mobile app for field data Pros: ✓ Standardization • Better quality • Lower error • Faster ✓ Real time data synchronization • Team work over the field ✓ Real time data processing • Accuracy • Saves time • Rapid response
Berry Analyzer Algoritm collection for trait quantification based on laboratory images Pros: ✓ Reduce subjective evaluation ✓ Increases precision of data ✓ Faster results ✓ Wider window opportunity for decision making ✓ Tool available at: https://berry- analyzer.agroinformatica.cl/
Correlation on berry size phenotype Berry Analyzer vs caliper Equatorial Polar diameter diameter Caliper (mm) Caliper (mm) R 2 0.973 R 2 0.938 Berry Analyzer (mm) Berry Analyzer (mm) https://berry-analyzer.agroinformatica.cl/
Correlation on rachis size phenotype Rachis area vs rachis weight R 2 0.930 https://berry-analyzer.agroinformatica.cl/
Correlation on cluster size phenotype Cluster area vs cluster weight R 2 0.930 https://berry-analyzer.agroinformatica.cl/
High throughput 102.595 colors color phenotyping 6.807 colors
High throughput color phenotyping: Define chromatic profiles ● Green ● Yellow ● Red ● Dark blue ‘C rimson ’ CLUSTER at harvest
Chromatic profile of ‘Crimson’ BUNCH at harvest 17.7% 54.7% Green Red 20.7% 6.9% Yelllow Blue
Chromatic profile of ‘Crimson’ RACHIS at harvest 97.7% 0.4% 1.9% Green Red Brown
Chromatic profile of ‘Crimson’ RACHIS after 30 days cold storage 34.5% 3.6% 59.9% Green Red Brown
Chromatic profile of ‘ Iniagrape- one’ RACHIS at harvest 91.7% 5.6% 2.8% Green Red Brown
Chromatic profile of ‘ Iniagrape- one’ RACHIS after 30 days cold storage 78.0% 9.3% 12.8% Green Red Brown
Phenotype – genotype association (GWAS) • Phenotype • Germplasm collection: one season, one location, one to three plants per genotype, six clusters per plant (harvest and postharvest), ten berries per cluster. • Breeding program families: one season, one location, one plant per genotype, four to six clusters per plant (harvest and postharvest), ten berries por cluster. • 88.143 image-derived data points acquired during the last season (finished in May!). • Covariates such as seed dry weight, soluble solids content, etc
Phenotype – genotype association (GWAS) • Genotyping by sequencing 850 samples from germplasm collection and breeding families. 60k quality SNPs markers • Work in progress …. Association mapping of 500 samples and 30k SNPs using linear mixed model with two first eigenvalues from PCA and Kinship matrix
‘ Flame ’ progeny PCA2 Selección 23 progeny ‘Italia’ progeny INIA germoplasm collection PCA1
GWAS: Validation LMM using seed dry weight FONDECYT de iniciación • Mapeo asociativo. Manhattan plots, tabla de heredabilidades Marcador VvAGL11
09-PMG7229 Iniciación 11161044 Acknowledgments INIA Collaborators • Pablo Cid • Bruno Defilippi • Inti Pedroso • Humberto Prieto • Felipe Belemmi • Patricio Hinrichsen • Miguel Angel García
Recommend
More recommend