the future of ultra broadband in emerging markets the
play

The future of (ultra) broadband in emerging markets: the Latin - PDF document

The future of (ultra) broadband in emerging markets: the Latin American case markets: the Latin American case Dr. Ral L. Katz, Adjunct Professor, Division of Finance and Economics, and Director, Business Strategy Research, Columbia Institute


  1. The future of (ultra) broadband in emerging markets: the Latin American case markets: the Latin American case Dr. Raúl L. Katz, Adjunct Professor, Division of Finance and Economics, and Director, Business Strategy Research, Columbia Institute of Tele- information State of Telecom Conference Columbia Institute for Tele-Information New York, New York October 15,2011 
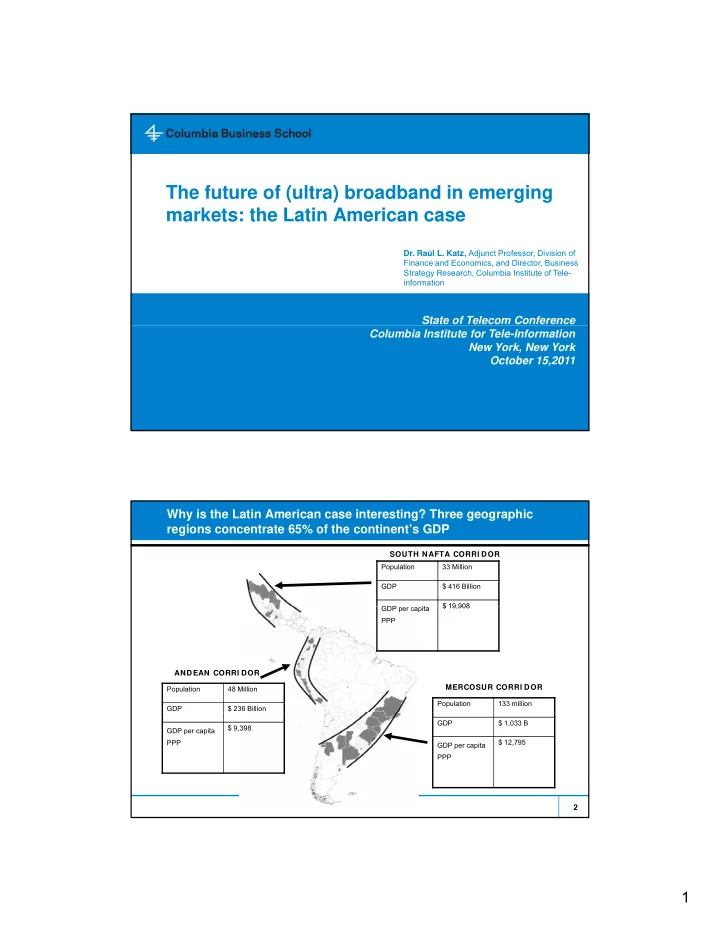
Why is the Latin American case interesting? Three geographic regions concentrate 65% of the continent’s GDP SOUTH NAFTA CORRI DOR Population 33 Million GDP $ 416 Billion $ 19 908 $ 19,908 GDP GDP per capita it PPP ANDEAN CORRI DOR MERCOSUR CORRI DOR Population 48 Million Population 133 million GDP $ 236 Billion GDP $ 1,033 B $ 9,398 GDP per capita PPP $ 12,795 GDP per capita PPP 2 1

  2. Why is the Latin American case interesting: the role of cities and the rising middle class COMPARATIVE TELECOMMUNICATIONS ADOPTION (2010) COUNTRY COUNTRY/CITIES WIRELINE WIRELESS INTERNET BROADBAND Brazil Country 21,70% 104,68% 43,00% 7,22% Sao Paulo 37,98% 121,99% … 15,43% Rio de Janeiro 33,16% 114,87% … 10,26% Minas Gerais 20,09% 100,59% … 7,15% Argentina Country 24,50% 141,79% 11,79% 9,56% Buenos Aires 40,00% 200 % 43,56% 40,58% Córdoba 25,00% 150 % 11,56% 11,12% Santa Fe 25,00% 138 % 10,89% 10,39% Sources: Brazil (Anatel; Euromonitor), Chile (Subtel), Argentina (Indec, CNC); Euromonitor); analysis by the author Mendoza 19,00% 139 % 7,47% 7,03% 3 Chile Country 12,53% 116,00% 10,45% Broadband penetration in Latin American is low COMPARATIVE TECHNOLOGY ADOPTION (2010) pulation) 120% 109% 100% netration (per 100 pop 81% 80% 65% 65% 60% 46% 36% 40% 30% 30% 25% 22% 24% 20% 17% 16% 18% 20% 10% 10% 9% 7% 8% 4% 6% 0% 2% 0% a a a a Pen c t t e a s S d c i c p c l f a I i i i r r o r i C c E o e e r r a f W m m A u P e E A A l - d a d h n i s i t M i r A t a o L N Internet PCs Broadband Source: ITU 4 4 2

  3. The current access infrastructure comprises four tiers, with in some cases fixed broadband capacity vastly exceeds product offerings D Zones (****) • HSDPA (partial) C Zones (***) B Zonas (***) ( ) A Zones (*) • ADSL • ADSL 2+ • Cable • ADSL • Cable (DOCSIS 3.0 y 2.0) (DOCSIS 2.0) • HSDPA • HSDPA • HSDPA (*) High consumption zones concentrating industrial, commercial establishments and upscale segments (**) Second tier cities (***) Suburban areas (****) Rural and isolated areas 5 The primary fixed broadband gap is demand driven BROADBAND SUPPLY (COVERAGE) VS. DEMAND (PENETRATION) (2010) 100% 94% 92% 90% 90% 80% 80% 70% 63% 59% 60% 50% 40% 30% 20% 10% 10% 7% 6% 10% 3% 0% Argentina Ar entina Brazil Bra il Colombia Colombia Me ico Mexico Per Peru Fixed broadband coverage Broadband penetration Source: Operators; ITU; analysis by the author 6 3

  4. With high price elasticity, fixed broadband rates are a big obstacle FIXED BROADBAND PRICING PRICING AND PENETRATION 50% $500 45% $450 40% $400 ration 35% $350 Household Penetr 30% $300 25% $250 20% $200 15% $150 10% $100 5% $50 0% $0 g a á a a a e o l a y y r ú r s a a a 0 0 0 0 0 0 0 0 0 0 0 v l i i m c a o n o l u i c b s n a a r d a a e l v i 5 0 5 0 5 0 5 0 5 0 A h i m a a u R i u d e r g C x t i a c P a m u u i 1 1 2 2 3 3 4 4 5 D é r n n g g i a o l o B a a u n v e d z r M l e a u l n e a B C o g P r t r c m i a a t U s a E S o n c E C r o u A P o H e N i Price per Mbps US $ PPP O C l G V D E . p e e R R Price per Mbps US $ PPP Why are rates high? • In some countries, limited infrastructure-based competition • In most countries, submarine cable pricing represents 30% of the cost structure 7 7 On the other hand, wireless telephony has reached universal penetration COMPARATIVE WIRELINE/WIRELESS PENETRATION ation) 160% 140% tion (per 100 popula 120% 100% 80% 60% 40% 20% 0% Oriente el Norte Latina Oriente Europa Mundo Asia CIS Eu America L Africa y Medio O Medio Or M America del Penetrat Wireline Wireless Source: ITU 8 8 4

  5. Furthermore, wireless devices are rapidly transitioning to 3G and 4G BRAZIL: WIRELESS DEVICES INSTALLED BASE 300,000,000 250 000 000 250,000,000 200,000,000 150,000,000 100,000,000 50 000 000 50,000,000 0 2000 2001 2002 2003 2004 2005 2006 2007 2008 2009 2010 2011 2012 2013 2014 2015 2016 2017 2018 2019 2020 2G Subscribers 3G and 4G Subscribers NOTE: 3G and 4G include feature phones, smartphones, USB devices, connected netbooks and tablets Source: Wireless Intelligence; IDC shipment data; analysis by the author 9 By 2016, the largest five Latam countries will reach 170 million mobile broadband devices, and traffic will grow at 117% p.a. MOBILE BROADBAND CONNECTED PCs SMARTPHONES (000) AND OTHER DEVICES (000) 180000 10000 160000 9000 140000 8000 7000 120000 120000 CAGR* CAGR 6000 (2008 ‐ 11): 179% 100000 (2008 ‐ 11): 112% (2011 ‐ 16): 50% 5000 (2011 ‐ 16): 47% 80000 4000 60000 3000 40000 2000 20000 1000 0 0 2008 2009 2010 2011 2012 2013 2014 2015 2016 2008 2009 2010 2011 2012 2013 2014 2015 2016 Argentina Brazil Colombia Mexico Peru MOBILE DATA TRAFFIC (Argentina, Brazil, Colombia, México y Perú) (Gigabytes/month) 2008: 362,370 Gigabytes 2011: 11,906,677 Gigabytes CAGR (08 ‐ 16): 117 % 2016: 180,214,314 Gigabytes Sources: Wireless Intelligence; Ovum; Strategy Analytics; Validas; Wirex; ABI Research; análisis TAS 10 5

  6. Primary driver is low cost devices, decreasing service rates, prepaid and tiered offerings WIRELESS PRICE PER MINUTE (2008 ‐ 10) 1.2 1.0 0.8 0.6 0.4 0.2 0 0 0.0 4Q08 1Q09 2Q09 3Q09 4Q09 1Q10 2Q10 3Q10 4Q10 Argentina Brasil Chile Colombia Mexico Peru 11 LTE deployments, contingent upon spectrum availability, will address the wireless broadband supply gap COMPARATIVE TECHNOLOGY COVERAGE 100% 95% 94% 95% 94% 90% 92% 90% 89% 90% 80% 80% 75% 75% 75% 75% 65% 70% 63% 59% 60% 52% 50% 39% 40% 30% 20% 10% 0% Argentina Brazil Colombia Mexico Peru Fixed broadband coverage Current mobile broadband coverage (3G) Estimated mobile broadband coverage with 700 MHz band 12 6

  7. The future (2015) broadband access infrastructure D Zones (****) • HSDPA (partial) • Community ADSL C Zones (***) • LTE (post 2015) B Zones (***) ( ) A Zones (*) • ADSL • ADSL • ADSL 2+ • Cable (DOCSIS • HSDPA+ • Cable (DOCSIS 3.0) 3.0) /LTE • FTTH • HSDPA+/LTE • HSDPA+/LTE (*) High consumption zones concentrating industrial, commercial establishments and upscale segments (**) Second tier cities (***) Suburban areas (****) Rural and isolated areas 13 In conclusion, the (ultra) broadband picture in Latin America is quite applicable to other emerging markets ● Universal adoption of 3G and 4G devices ● Spectrum reallocation to facilitate LTE deployment (with some acceleration of schedules in Peru, Uruguay, Mexico) ● Ultra-broadband facilities in first tier cities (Buenos Aires, Sao Paulo, Santiago, Ultra broadband facilities in first tier cities (Buenos Aires Sao Paulo Santiago Bogota, Mexico City (?), Lima (?)) ● In second tier cities ultra-broadband will be cable led through DOCSIS 3.0 ● Backbone and submarine cable potential bottlenecks will be addressed through alternative private (electric utilities) or government-owned facilities 14 7

  8. 15 8

Download Presentation
Download Policy: The content available on the website is offered to you 'AS IS' for your personal information and use only. It cannot be commercialized, licensed, or distributed on other websites without prior consent from the author. To download a presentation, simply click this link. If you encounter any difficulties during the download process, it's possible that the publisher has removed the file from their server.

Recommend


More recommend